Generate a Report Back to top
Allocation reports give you a tabular breakdown of how team members are allocated across projects, epics, issues, and custom categories over a given date range. Reports can be viewed directly in the plugin or exported to Excel for sharing and further analysis.
- Click the "Report" button in the toolbar. The Generate Report dialog opens.
- Configure the report — select the source, team, date range, and aggregation level (see Report Configuration below).
- Click "Generate Report" to produce the allocation report.
Report Configuration Back to top
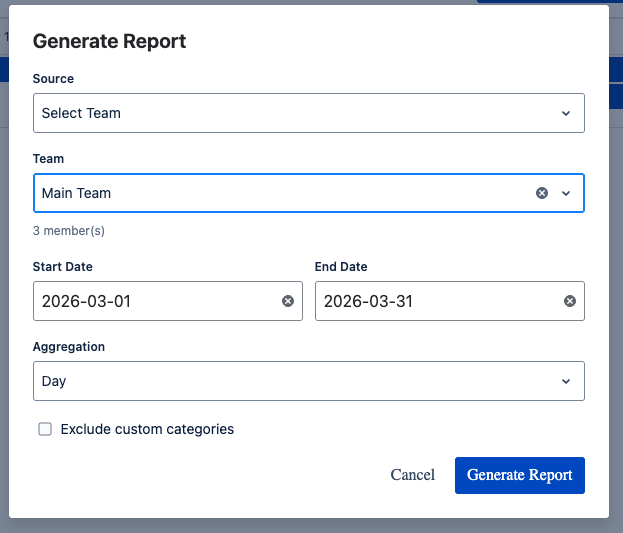
The Generate Report dialog lets you control exactly what data appears in the report:
- Source — choose Select Team to generate the report based on a specific team's members.
- Team — pick the team whose members you want to report on. The number of members is shown below the dropdown (e.g. "3 member(s)").
- Start Date / End Date — define the reporting period. Only bookings that overlap this date range are included.
- Aggregation — choose how time columns are grouped:
- Day — one column per calendar day, showing hours allocated each day.
- Week — one column per week, showing total hours for that week.
- Exclude custom categories — check this option to omit bookings linked to custom categories (e.g. "Internal Meetings", "Training") and show only Jira work items (projects, epics, issues).
Report View Back to top
Once generated, the report replaces the timeline with a detailed allocation table. The report header shows the team name, date range, and aggregation level for reference.
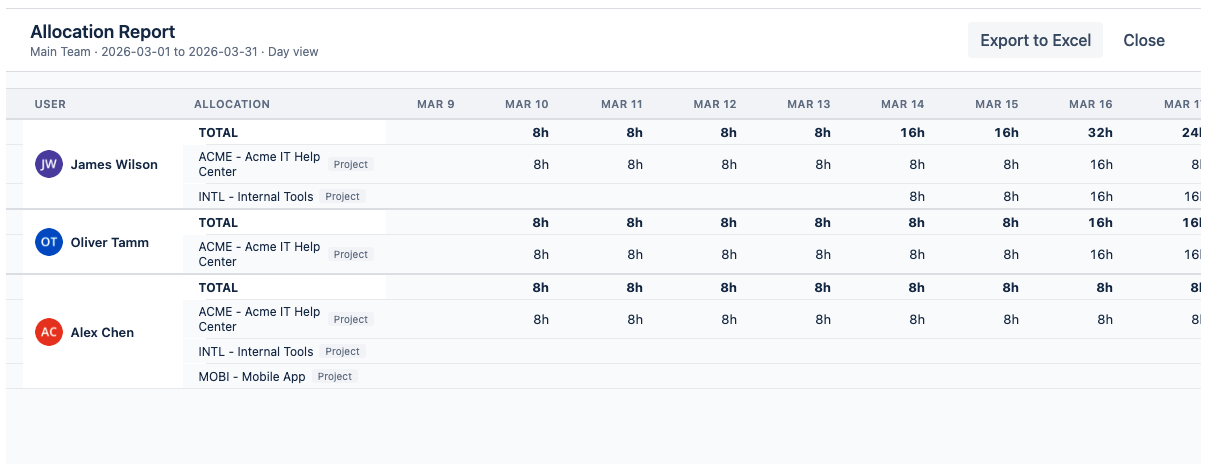
The report table is organized as follows:
- User column — each team member is listed with their avatar and name.
- Allocation column — shows the work target name (e.g. "ACME – Acme IT Help Center") and its type badge (Project, Epic, Issue, or Custom Category).
- TOTAL row — for each user, a bold TOTAL row sums all their allocations across all work targets for each time period.
- Time columns — depending on the aggregation setting, each column represents a day (e.g. "Mar 10") or a week. The cell value shows the total allocated hours for that user and work target in that period (e.g. "8h").
Reading the Report
The TOTAL row makes it easy to spot days where a user is over- or under-allocated. For example, if a user has 16h on a single day, they are double-booked across two work targets. Scroll horizontally to see the full date range.
Click "Close" in the top-right corner to return to the timeline view.
Export to Excel Back to top
You can export the allocation report to an Excel spreadsheet for offline analysis, sharing with stakeholders, or archiving.
- Generate a report using the steps above.
- Click "Export to Excel" in the top-right corner of the report view.
- An .xlsx file is downloaded to your computer with the same data shown in the report table — users, work targets, totals, and time columns.
Tip
Use the exported Excel file to build custom charts, share allocation summaries with management, or compare planned vs. actual hours in your own spreadsheet workflows.
Need Help?
If you have questions or need assistance, our support team is here to help.
Contact Support