Overview
The workload overlay turns the Resource Scheduler into a capacity-aware planning tool. When you switch it on, every cell in the scheduler grid gets a color-coded indicator. At a glance you can see whether a team member is overloaded, at capacity, or has room for more work on any given day.
Capacity is the number of working hours a person is available per day, set by their work capacity scheme. Utilization is the share of that capacity consumed by scheduled work.
The overlay pulls together scheduled hours from tasks, available capacity from capacity schemes, public holidays from holiday schemes, and approved leave. The result is a single, real-time picture of how work is spread across the team.
Enabling Workload View
One click is all it takes. The workload layer appears on top of the existing task bars and disappears just as quickly.
Open the Resource Scheduler
Navigate to any board (Board View) or open the Workspace View.
Click the Workload toggle
In the scheduler toolbar at the top, click the Workload button to enable the overlay.
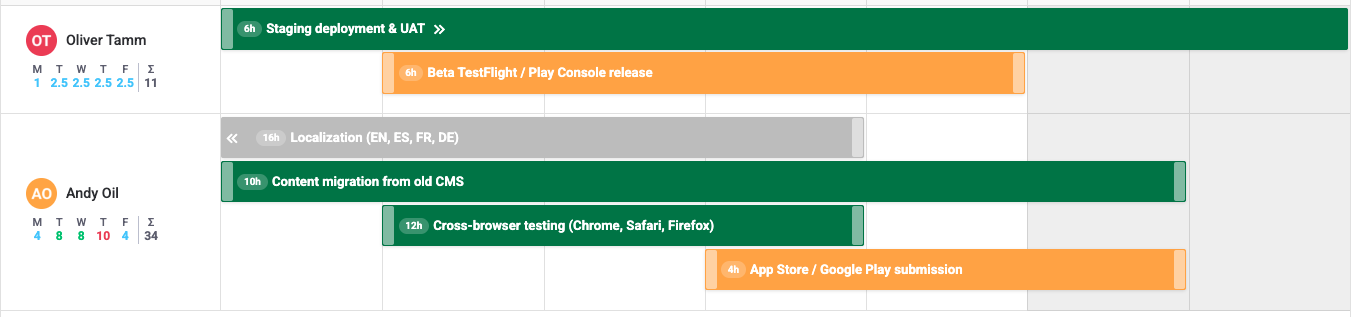
Review the indicators
Each cell now shows scheduled hours vs. capacity as a color-coded indicator. Hover over a cell for a detailed tooltip.
Color Legend
Colors tell you instantly how loaded a person is. Blue and green mean things are fine. Yellow signals that a person is approaching their limit. Red means they are over capacity and need relief.
| Color | Utilization Range | Meaning |
|---|---|---|
| Light Blue | 0% – 50% | Underloaded — plenty of room for more work |
| Green | 51% – 100% | Healthy utilization — at or near capacity |
| Yellow / Orange | 101% – 120% | Near capacity — consider rebalancing soon |
| Red | > 120% | Overloaded — reassign or reschedule tasks |
| Blue | N/A | Vacation / Leave — approved time off, no tasks expected |
| Purple | N/A | Conflict — tasks are scheduled on a leave or holiday day |
| Orange | N/A | Holiday — public holiday from the assigned holiday scheme |
| Grey / Striped | N/A | Non-working day — weekend or zero-capacity day |
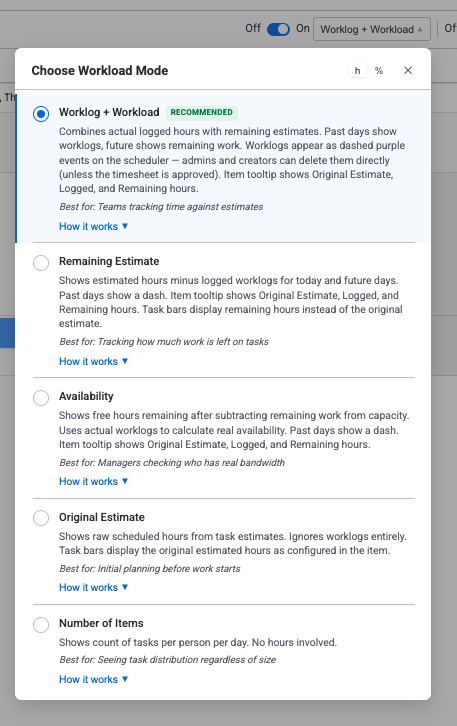
Indicator Modes
The overlay supports four indicator modes. Click the mode selector next to the Workload toggle to choose the view that fits your situation. Each mode shows a description to help you decide.
| Mode | What It Shows | Best For |
|---|---|---|
| Remaining Estimate (default) | Past days: dash (–). Today + Future: remaining estimate (Original Estimate minus logged hours). | Tracking how much work is left — ignore the past, focus on what remains |
| Availability | Past days: dash (–). Today + Future: free hours (capacity minus remaining work). Can show negative when overloaded. | Finding who has room for a new task right now |
| Original Estimate | All days: scheduled hours from the estimate column, ignoring worklogs entirely. | Classic workload view — pure plan without actuals |
| Number of Items | Count of tasks per person per day. No hours involved. | Spotting context-switching — many small tasks can be harder than few large ones |
How Remaining Estimate Works
In the Remaining Estimate and Availability modes, the workload indicator uses remaining estimates instead of raw planned hours:
- Remaining = Original Estimate − Total Logged Worklogs
- Remaining hours are distributed across future working days only (from today onward)
- If worklogs exceed the estimate, remaining clamps to 0 — the item shows a red dashed border as an overlog warning
- For multi-assignee items, remaining is split evenly:
remaining per person = total remaining / number of assignees - Hours Per Day items keep their constant daily rate — worklogs do not reduce per-day rates
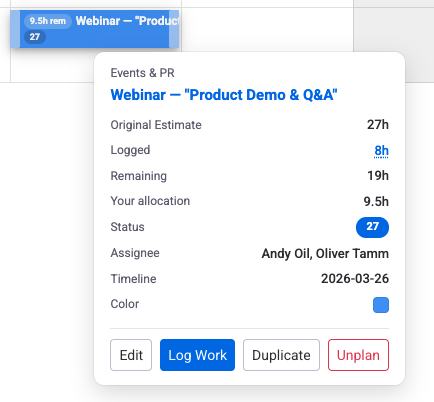
The item tooltip shows all the details: Original Estimate, Logged (clickable — opens the worklogs list), Remaining, and Your Allocation when the item has multiple assignees.
How Workload Is Calculated
The system computes a utilization percentage for every user on every day:
Where Available Capacity is:
Workload Hours depend on the active indicator mode:
- Remaining Estimate: Past = excluded (dash). Today + Future = remaining estimate (Original Estimate − logged worklogs). This is the base calculation that other modes build on.
- Availability: Shows free hours instead of used hours. Past = excluded (dash). Today + Future = Available Capacity − Remaining Estimate. Positive values mean the person has room for more work; negative values mean they are overbooked.
- Original Estimate: All days = raw scheduled hours from the estimate column (worklogs ignored).
- Number of Items: Uses item count instead of hours — no utilization percentage.
For Original Estimate items (total format), remaining hours are calculated as:
Remaining hours are distributed across future working days only (from today onward), accounting for holidays, leaves, and capacity schedules. When per-person distribution is enabled, remaining hours are split equally among assignees. Hours Per Day items keep their constant daily rate — worklogs do not reduce per-day rates. See Original Estimate vs Hours Per Day for details.
Worked Example
A team member has a standard 8 h/day scheme. On Monday three tasks are assigned:
- Task A — 4 h
- Task B — 2 h
- Task C — 3 h
Total scheduled: 9 h / 8 h = 112.5% — shown as Yellow (near capacity, 101–120%).
Capacity with Holidays & Leave
Available capacity is not always the raw number from the scheme. Holidays and approved leave reduce it, and the workload indicator adjusts automatically.
| Scenario | Effect on Capacity | Indicator |
|---|---|---|
| Regular working day | Full capacity from scheme (e.g. 8 h) | Normal color-coded cell |
| Public holiday | Capacity = 0 h | Orange |
| Full-day leave | Capacity = 0 h | Blue |
| Half-day leave (AM or PM) | Capacity reduced by 50% (e.g. 8 h → 4 h) | Normal indicator against reduced capacity |
| Weekend (0 h in scheme) | Capacity = 0 h | Grey / Striped |
A team member with 8 h/day capacity takes a half-day leave on Wednesday. Available capacity drops to 4 h. With 3 h of scheduled work, utilization is 3 / 4 = 75% — Green. With 5 h it would be 5 / 4 = 125% — Red.
Display Modes
Choose how values appear inside the cells. Toggle between the two modes in the scheduler toolbar.
| Mode | Format | Best For |
|---|---|---|
| Hours (h) | 2.5 per day, with a weekly total in the header |
Exact daily planning and knowing how many hours are free |
| Percentage (%) | 62% |
Quick visual scan of utilization across the week or month |
Per-Person Distribution
When a task has more than one assignee, you need to decide how the hours are counted. The per-person distribution setting controls this.
| Setting | Behavior | Example |
|---|---|---|
| Enabled (split hours) | Hours are divided equally among assignees | 8 h task with 2 assignees → 4 h each |
| Disabled (full hours) | Each assignee is charged the full hours | 8 h task with 2 assignees → 8 h each |
Practical Tips
During Sprint Planning
- Turn on the workload overlay before assigning tasks so you can see capacity impacts in real time.
- Aim for green across the team — 51% to 100% utilization is the sweet spot.
- If you spot red cells, move tasks to team members who still have room.
Fixing Overloaded Days
- Reassign tasks — shift work to someone with available capacity.
- Extend timelines — spread the task over more days to lower the daily load.
- Break up large tasks — split them and prioritize what must ship first.
- Correct estimates — if the original estimate was too high, update it.
Stay on Top of Changes
Check the workload view at least once a week. New tasks, shifting priorities, and late leave requests can turn a balanced Monday into a red Wednesday.
Combine with Other Features
- Work Capacity Schemes — make sure every team member has the right scheme for accurate calculations.
- Holiday Schemes — assign the correct holiday calendar so public holidays reduce capacity automatically.
- Leave Management — approved leave feeds straight into the workload formula. Encourage early submissions.
- Reports — use the Utilization Report for historical trends across weeks or months.
Related Pages
- Resource Scheduler — the planning view where the workload overlay lives.
- Work Capacity Schemes — define daily working hours per team member.
- Holiday Schemes — manage public holidays that reduce available capacity.
Need Help?
Questions about workload management or capacity setup? Our support team is ready to help.
Live Chat