Overview Back to top
My Work is your personal home in WorkHub. It pairs the scheduler row that represents you with a daily logged-hours chart, so you can see at a glance what you are committed to and how your logged hours compare to your real capacity (your work schedule, minus approved leave and assigned holidays).

The view is locked to your own row — you cannot switch to another person here. To plan or review work for the whole team, use the standalone Resource Scheduler.
What you can do here
- See your week (or month, or year) at a glance — assigned issues, allocations, leave, and holidays on a single timeline row.
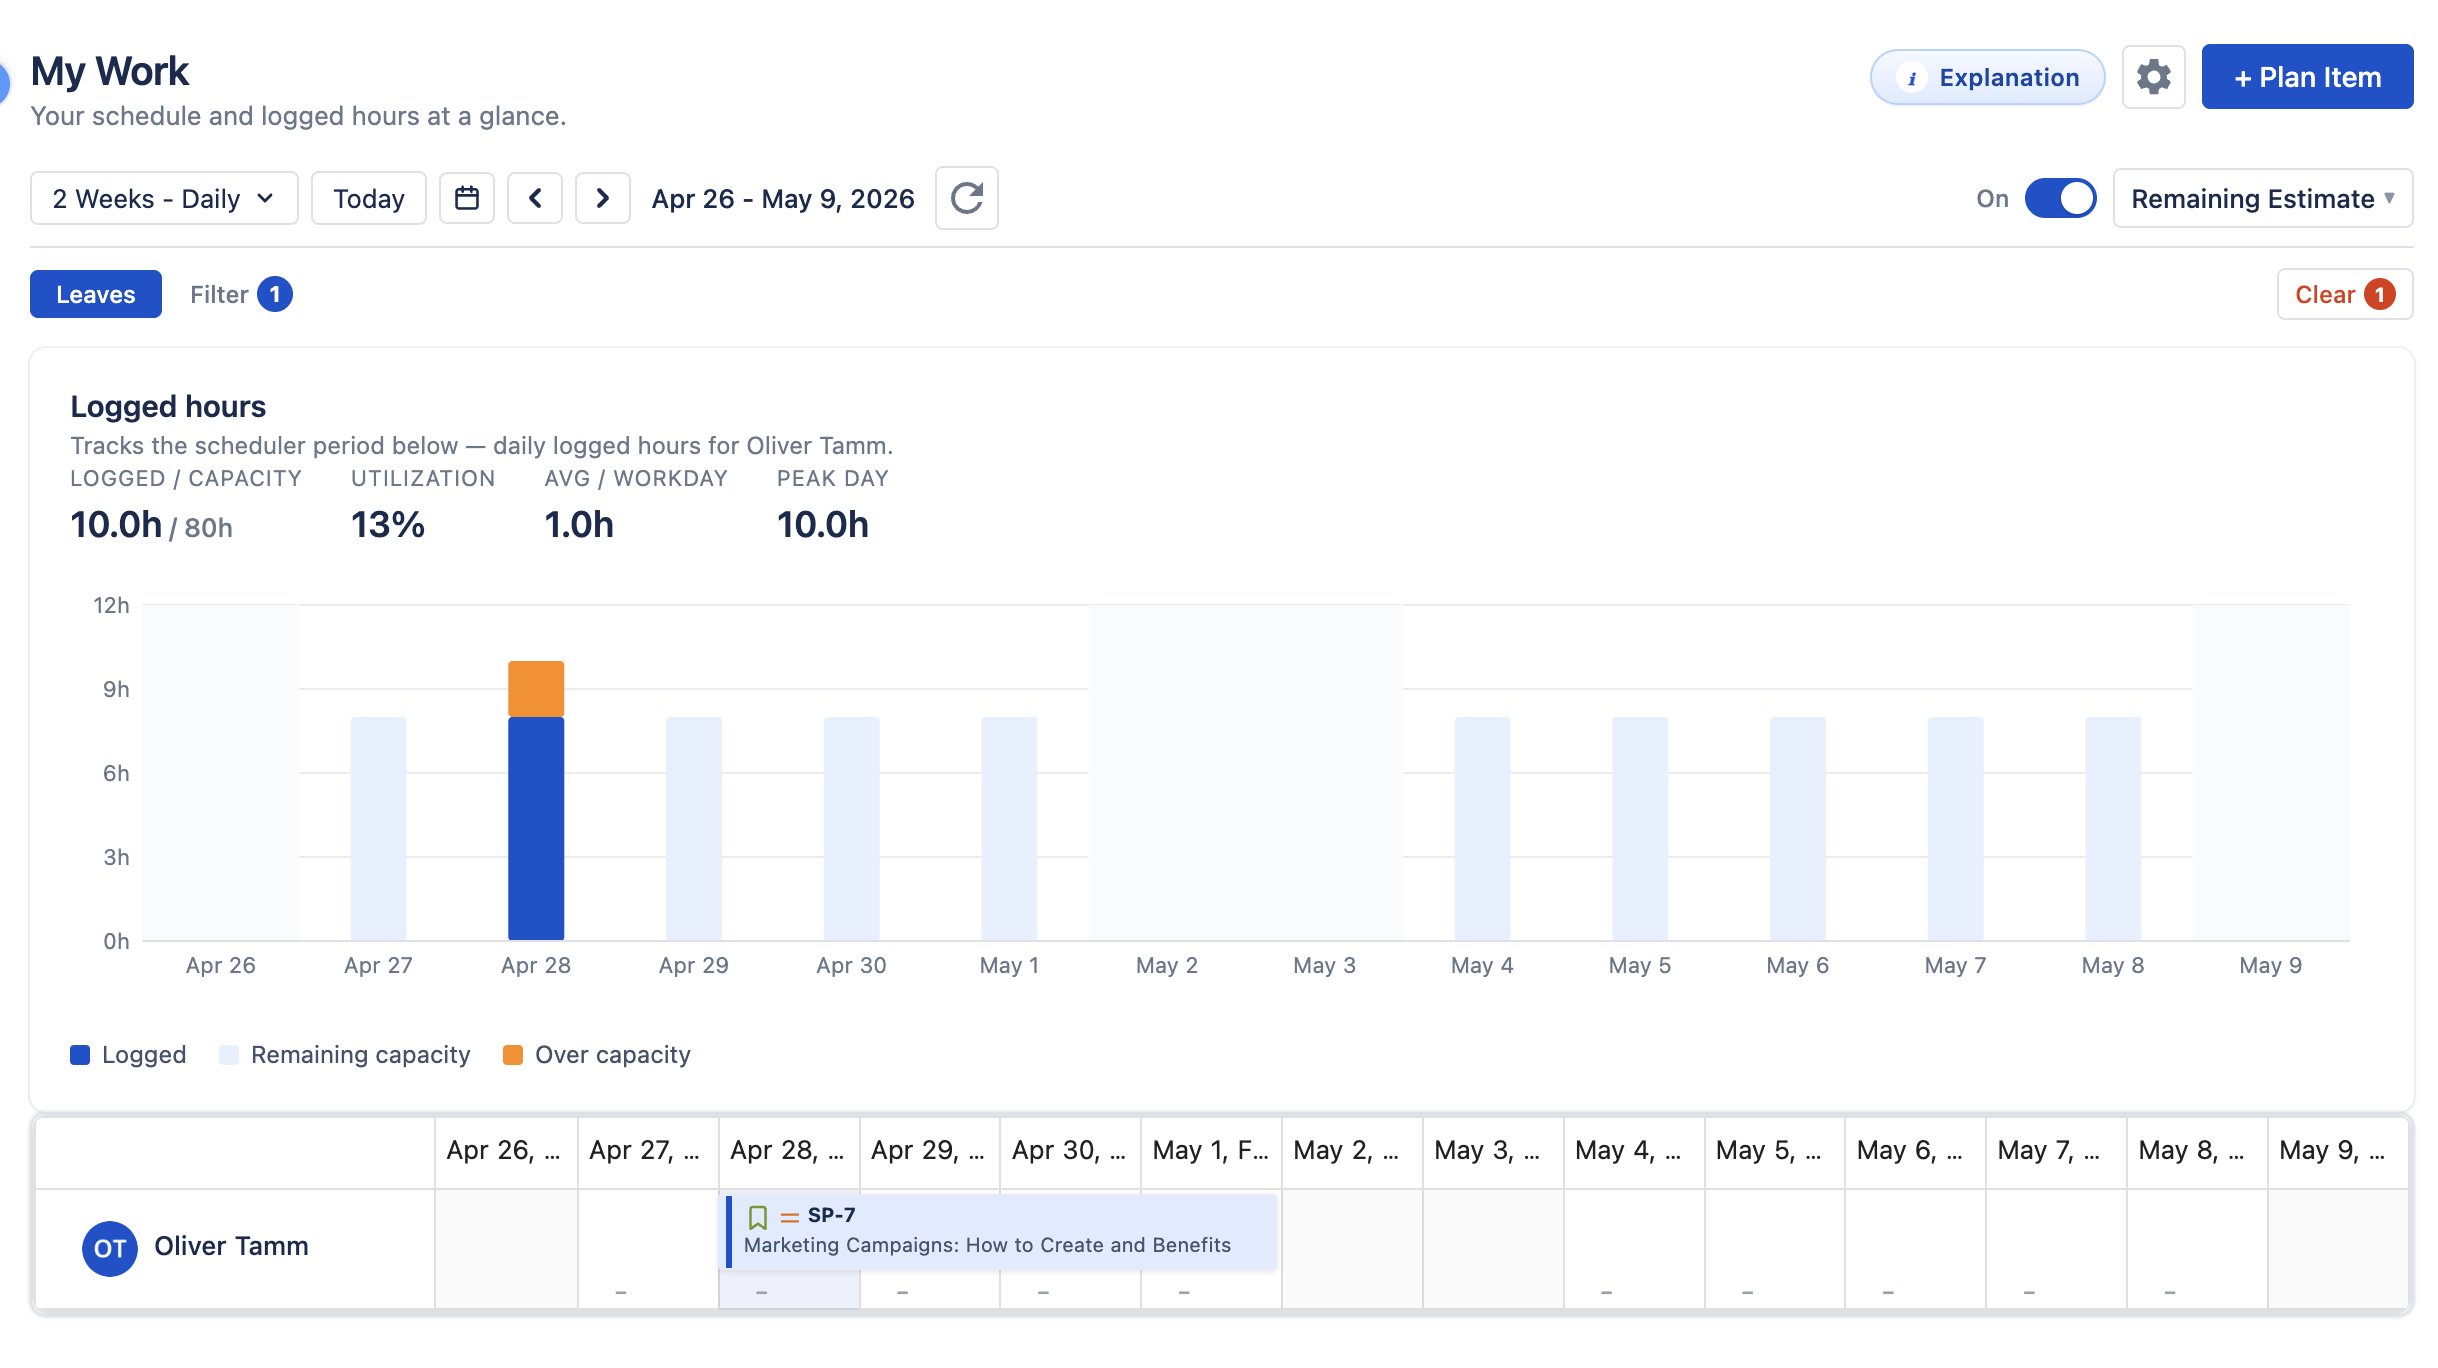
- Compare logged hours to capacity — the chart on top shows daily logged time as a fill against your daily capacity, with overflow highlighted when you logged more than your capacity.
- Plan and log work — use Plan Item to add a Jira issue to your schedule, or right-click a cell to log time, schedule an issue, or request leave.
- Move through time — the period navigator and time scale apply to both the chart and the timeline at once.
Logged Hours Chart Back to top
The chart sits between the scheduler controls and the timeline. Every bar represents one day in the same period as the timeline below. Logged hours include both Jira issue worklogs and allocation (internal) worklogs, summed together per day — time logged against a "Training" or "Meetings" allocation counts toward your utilization the same way an issue worklog does.
Summary stats
Above the chart you see four numbers that always reflect the period currently visible on the timeline:
- Logged / capacity — total hours you logged in this period, over your real capacity for the same period (capacity already has approved leave and holidays subtracted).
- Utilization — logged divided by capacity, expressed as a percentage. 100% means you logged exactly your capacity; over 100% means you logged more.
- Avg / workday — mean logged hours per working day in the period (non-working days excluded).
- Peak day — the highest single-day logged total in the period.
Bar anatomy
Each working day renders a capacity track — a light-blue bar that represents your capacity for that day. The track is filled from the bottom with your logged hours:
| Color | Meaning |
|---|---|
| Blue (Logged) | Hours you logged that day, up to your capacity. |
| Light blue (Remaining capacity) | Capacity you have not logged against yet on that day. |
| Orange (Over capacity) | A segment that pokes above the track when you logged more than your capacity for the day. |
| Gray (Logged on non-working day) | A slim gray bar that appears on a day with zero capacity (weekend, holiday, or full-day approved leave) when you logged hours anyway. Useful for spotting accidental or after-hours logs. |
Capacity respects leaves and holidays
The capacity number is not a flat 8h/day. It is your assigned capacity scheme minus:
- Full-day approved leave — reduces capacity to 0 for that day (no track is drawn).
- Partial approved leave — reduces capacity for that day by the hours taken off.
- Holidays from your assigned holiday calendar — reduce capacity to 0 for that day.
This means utilization stays meaningful when you take time off — logging 4h on a day with 4 hours of leave reads as 100% utilization, not 50%.
Hover any bar to see a tooltip with the exact logged hours and capacity for that day. Days that go over capacity also tell you by how much.
My Schedule Timeline Back to top
Below the chart you have the same timeline you'd see on the standalone Resource Scheduler — just locked to your row.

It supports the same interactions as the full scheduler:
- Drag horizontally — shift an issue or allocation to a new date range while keeping its duration.
- Resize the right edge — extend or shorten an issue's end date.
- Right-click a cell — opens the cell context menu with Schedule Issue, Create Allocation, Log Work, and Request Leave actions.
- Click an issue, allocation, or leave bar — opens a detail popover with status, dates, hours, and quick actions.
- Workload indicators — the small colored bars under each cell show how much of your remaining capacity is consumed for that day. Toggle the indicator on the right of the header.
Two scheduler header buttons are intentionally hidden in My Work because they are team-scope:
- Bulk Allocate — only available on the standalone Resource Scheduler, where you can pick which users to allocate to.
- Team / User filter — the row is fixed to you, so the picker is hidden.
For the full set of timeline behaviors, see Resource Scheduler.
Click the palette icon () in the header to open the Explain colors dialog. It lists every active color rule in priority order plus the default-appearance fallback, so you can see at a glance why a bar got its color. The full feature reference is in Issue Colors.
Header & Controls Back to top
The header pulls everything together — the page title, the action buttons, and the time-scale controls all share a single row at the top of the view.
- Time scale (Week / 2-Week / Month / Year monthly / Year daily) — controls how many days fit on the timeline. The chart range follows.
- Today — jump back to the current period.
- Date picker, ◂ ▸ — navigate to a specific date or step backward/forward by one period.
- Refresh (↻) — reload both the timeline data and the logged-hours chart in one click. Triggered automatically after Log Work, Schedule Issue, and other mutations.
- Workload toggle & mode — turn the workload indicator on/off and choose between Remaining Estimate, Original Estimate, or Availability mode (see Workload Management).
- Leaves filter — hide approved-leave bars from the timeline. Hidden leaves still reduce the capacity used by the chart.
- Settings (gear) — opens the admin Settings page (admins only).
- Plan Item — opens the issue search panel where you can add an existing Jira issue to your schedule.
- Explanation — opens an in-app help dialog explaining each component on the page and how to read the chart.
Period Sync Back to top
The chart and the timeline are linked. Whenever you change the time scale or navigate to a different period:
- The timeline shifts to that period.
- The chart re-fetches your worklogs for the same date range and re-renders.
- The summary stats (Logged/Capacity, Utilization, Avg/Workday, Peak Day) update accordingly.
So if you switch from 2 Weeks to Month, both the bars and the timeline grow to a month at once — you never have to set them separately.
Persisted View Back to top
WorkHub remembers whether you last looked at My Work or the standalone Scheduler and reopens the same one next time. The default for new users is the Scheduler. Switching between the two views in the sidebar updates this preference.
Tips Back to top
- Walk back through past periods — click ◂ a few times to see how your logged hours compared to capacity in earlier weeks; the chart refetches each time.
- If utilization looks low, check leaves and holidays — the chart already accounts for them, so an "underutilized" week may simply have a vacation day in it.
- Right-click a cell to log time — you do not need to navigate away to Time Tracking. The context menu lives directly on the timeline.
- Watch for gray bars — logged hours on a weekend, holiday, or full-day-leave day appear gray. They count toward your total but flag a possible mistake.
- Hover anywhere on the chart — tooltips give you the exact logged hours and capacity for any day, plus the over-capacity amount when applicable.
Need Help?
If you have questions or need assistance with WorkHub for Jira, our support team is here to help.
Contact Support