Overview Back to top
The workload overlay turns the Resource Scheduler into a capacity-aware planning tool. When enabled, color-coded indicators appear beneath each person for every day on the timeline, giving you an instant picture of who is underloaded, at capacity, or overbooked.
The indicators pull together data from multiple sources — scheduled issue hours, capacity schemes, holiday calendars, and approved leave — so you can see true utilization at a glance without switching between views.
In Year Monthly view, the indicators aggregate the same per-day data into one bar per month. Each month's scheduled, capacity, leave, and holiday hours are summed across the working days in that month, so the displayed utilization (and color tier) reflects true available capacity — for example, a month with a full week of vacation correctly shows a smaller denominator instead of comparing scheduled hours against unreduced raw capacity. The same color legend and unit toggle (hours vs %) apply.
Enabling Workload View Back to top
To activate the workload indicators, click the Workload toggle button in the scheduler toolbar. The button is located alongside the other toolbar controls (date navigation, view scope, filters).

- Click the toggle once to show workload indicators beneath each person row
- Click again to hide the indicators and return to the standard timeline view
- The toggle state persists within your browser session
Color Legend Back to top
Each workload indicator cell is color-coded to convey utilization status at a glance. The following colors are used:
| Color | Utilization Range | Meaning |
|---|---|---|
| Light Blue | < 50% | Underloaded — person has significant spare capacity |
| Yellow-Green | 50 – 79% | Moderate load — partially loaded, some slack remaining |
| Green | 80 – 100% | Near-full — healthy target utilization for most teams |
| Yellow / Orange | 101 – 120% | Near capacity — approaching overload, monitor closely |
| Red | > 120% | Overloaded — scheduled hours exceed capacity, action needed |
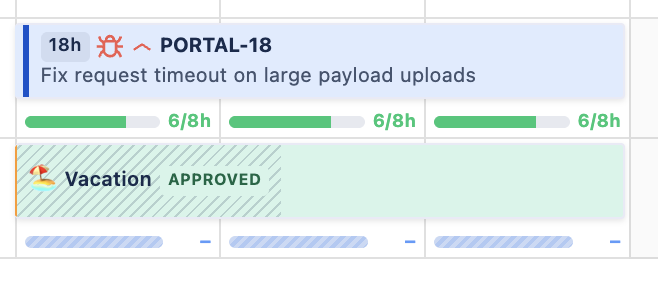
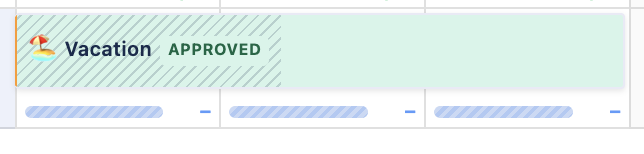
| Blue | — | Leave day — person is on approved time off |
| Purple | — | Conflict — issues are scheduled on a leave or holiday day |
| Orange | — | Holiday — day is marked as a public holiday in the assigned calendar |
| Grey / Striped | — | Non-working day — weekend or off day per the capacity scheme |
Workload Basis Back to top
An admin setting in Settings → General chooses how the plugin turns task estimates into daily workload across the whole site. It is what the Utilization Forecast and Project Resources reports follow, and it sets the default for the Scheduler's workload indicator.
- Live workload — workload reflects the work still remaining on each task, taken from Jira's time-tracking Remaining Estimate field, counted from today forward, and updates as people log time. Best for teams that log work in Jira regularly. This is the default.
- Planned workload — workload spreads each task's full estimate, taken from Jira's time-tracking Original Estimate field, evenly across its whole duration (including past days). Best for teams that rarely log work, such as teams that estimate in story points.
Teams that estimate in story points instead of hours can still get workload and capacity numbers — see Planning with Story Points below.
Planning with Story Points Back to top
Some teams estimate work in story points rather than hours. WorkHub can convert story points into hours so that story-point-estimated work still counts toward the workload indicator, capacity, and reports. Estimates keep showing as story points on the issues — the conversion only affects the workload and capacity math.
Set it up
In Settings → General → Story Point Conversion, set how many hours one story point represents (for example, 1 story point = 5 hours), choose which field holds story points, and — for issues that have both a time estimate and story points — pick whether Hours or Story points wins.
Story points represent a task's total effort and don't go down as work is logged. The Planned basis spreads that full estimate evenly across each task's whole duration, giving a stable capacity view. The Live basis instead counts remaining work from today onward, which doesn't fit story points since they never decrease.
Mixing story-point and hours projects
Conversion doesn't have to be all-or-nothing. If some projects estimate in story points while others use hours, set it per project in the Per Project Configuration tab. For each project you can inherit the global rate, set the project's own rate, or turn conversion off — and choose Hours or Story points independently. That way a story-point project converts its points to hours, while an hours project keeps its native time estimates untouched.
Indicator Modes Back to top
On the Scheduler, each person can choose how the workload indicator is displayed using the mode selector at the top of the overlay. These modes change the Scheduler view only — the Utilization Forecast and Project Resources reports always follow the site-wide Workload Basis above, not this per-person choice. Which options appear depends on that basis.
Live basis
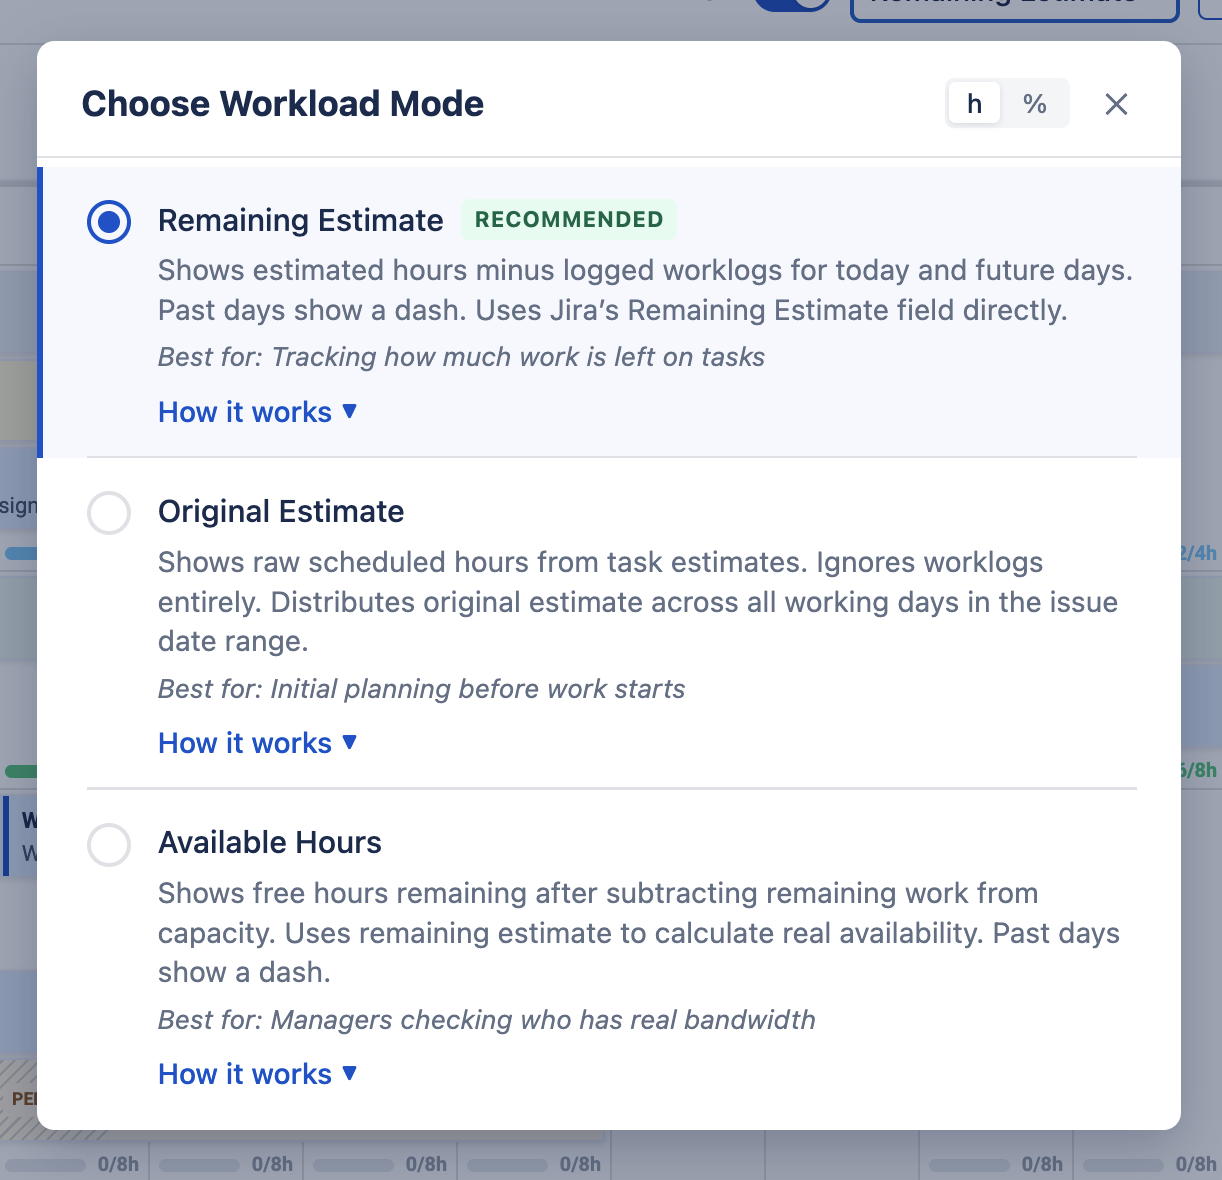
| Mode | Description |
|---|---|
| Remaining Estimate | The default. Distributes each issue's remaining estimate across future working days only; past days show a dash. A forward-looking view of work left to do. |
| Availability | Shows the free hours left per person per day after subtracting scheduled work from total capacity. |
| Original Estimate | Uses each issue's Original Estimate field, spread evenly across the issue's dates (past and future). A scheduler-only view — to base reports on original estimates too, switch the Workload basis to Planned. |
Planned basis
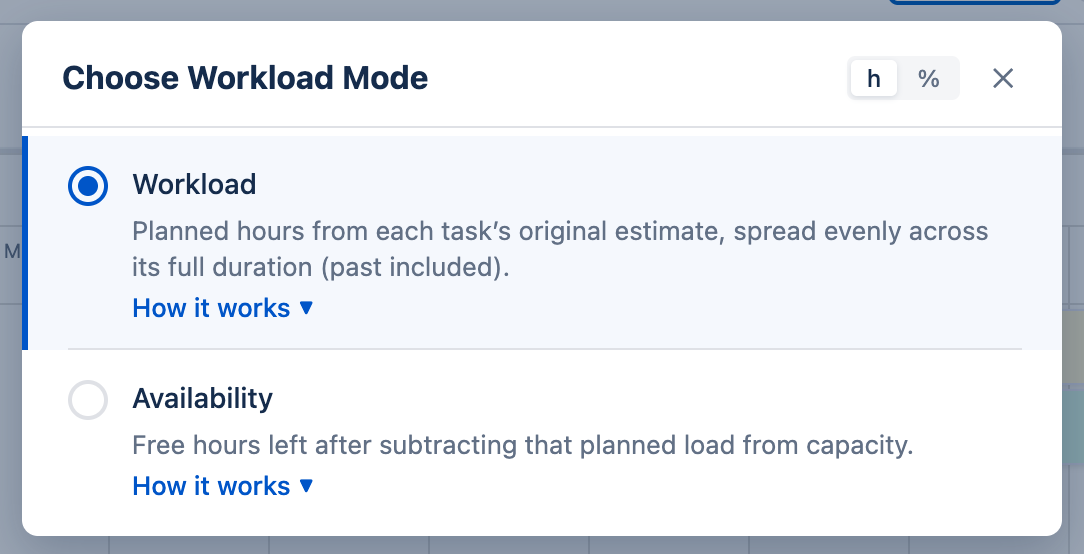
- Workload — planned hours from each task's original estimate, spread evenly across its full duration (past included).
- Availability — the free hours left after subtracting that planned load from capacity.
Which estimate feeds the Planned view is a site-wide choice made by an admin in Settings → General: either the original estimate (the default) or the remaining estimate, which decreases as work is logged. Either way the hours are spread across each task's full dates, past days included.
How Remaining Estimate Works Back to top
The remaining estimate represents how much work is left on an issue. Jira calculates it automatically:
Remaining Estimate Formula
Remaining Estimate = Original Estimate − Total Logged Worklogs
- Jira populates the remaining estimate from the original estimate when an issue is created
- As work is logged, Jira decrements the remaining estimate automatically
- The remaining hours are distributed evenly across future working days only within the issue date range
- If remaining estimate is zero or not set, the issue contributes nothing to workload
Issues in the Done status category keep counting toward workload per their estimates by default; an admin can exclude them entirely via the Resolved issues choice in Settings → General.
How Workload Is Calculated Back to top
The utilization percentage displayed in each workload cell is calculated using the following formula:
Utilization Formula
Utilization % = (Workload Hours / Available Capacity) × 100
Where:
- Workload Hours — the total scheduled/estimated hours for that person on that day (from issues, allocations, and worklogs depending on the selected mode)
- Available Capacity — the person's working hours for that day, minus any holiday or leave deductions
For example, if a person's capacity scheme assigns 8 hours on a Monday and they have 6 hours of scheduled work, their utilization is 75% (yellow-green — moderate load). At 7 hours (87.5%) the cell turns green (near-full). At 10 hours it is 125% (red — overloaded).
Split Issues Back to top
For a split issue, each person's workload counts only their own part's hours — never the whole issue. The Planned basis distributes a part's original hours across its date range; the Live basis distributes its remaining hours from today forward.
How a part's hours were entered decides how they spread across the days it covers:
- Total hours: A budget for the whole part, spread across its working days — 10h over 5 working days shows as 2h a day, and that daily figure changes if you stretch or shorten the dates. Use it when you know the size of the job.
- Hours per day: A fixed daily rate that contributes the same hours on every working day the part covers, whatever its length (respecting the owner's capacity scheme and holiday calendar). Use it for standing commitments such as a review or support shift.
- Burn-down: Work logged through WorkHub reduces the author's part remaining hours, so Live-basis load stays truthful as work progresses; when the issue is done, a part's remaining drops to zero. Worklogs created directly in Jira do not affect parts — a part's Remaining is editable in the Split editor as the correction.
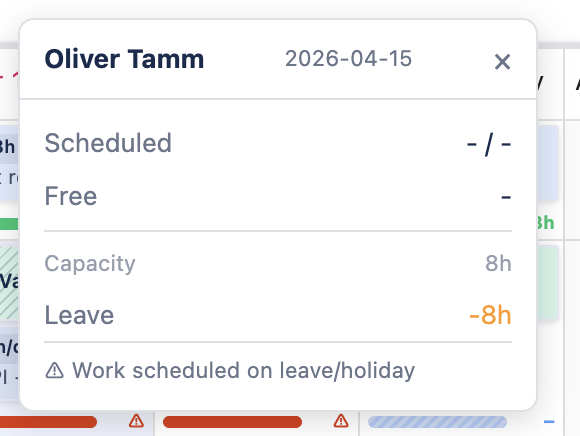
Workload Tooltip Back to top
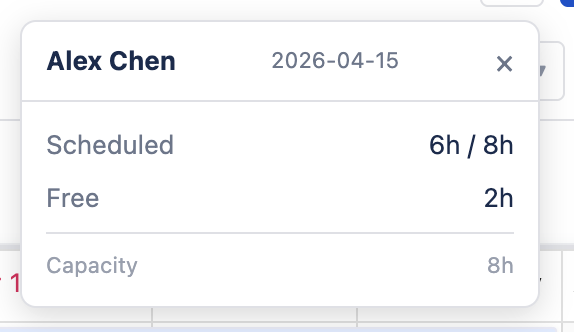
Click any workload indicator cell to open a detailed tooltip showing the capacity breakdown for that person on that day. The tooltip header displays the person's name and date.
Regular Working Day
On a normal working day, the tooltip shows:
| Row | What it shows | Example |
|---|---|---|
| Scheduled | Total hours scheduled that day vs total capacity (scheduled / capacity). | 6h / 8h |
| Free | Remaining available hours (capacity minus scheduled). | 2h |
| Capacity | The person's total capacity for that day from their capacity scheme. | 8h |
Leave or Holiday Conflict
When the day falls on approved leave or a public holiday, the tooltip adds extra rows:
| Row | What it shows | Example |
|---|---|---|
| Scheduled | Shows dashes (– / –) because no work should be scheduled. | – / – |
| Free | Shows a dash — no free capacity on a non-working day. | – |
| Capacity | The base capacity from the scheme (before leave deduction). | 8h |
| Leave | Hours deducted by approved leave, shown in orange. | −8h |
| Warning | If issues are scheduled on a leave/holiday day, a conflict warning appears. | Work scheduled on leave/holiday |
Capacity with Holidays & Leave Back to top
Available capacity is adjusted automatically based on holidays and approved leave. The following table shows how different day types affect available hours:
| Day Type | Capacity (8h scheme) | Available Hours |
|---|---|---|
| Regular working day | 8h | 8h |
| Public holiday | 8h | 0h |
| Full-day leave | 8h | 0h |
| Partial leave (2h off) | 8h | 6h |
| Weekend / non-working day | 0h | 0h |
Display Modes Back to top
Workload indicators can be displayed in two formats. Toggle between them using the display mode selector:
- Hours (h) — shows the absolute number of scheduled hours per cell (e.g., "6h / 8h"). Best for seeing exact hour counts.
- Percentage (%) — shows utilization as a percentage of available capacity (e.g., "75%"). Best for quickly spotting over- or under-utilization patterns across the team.
Practical Tips Back to top
Here are some practical ways to get the most out of workload management:
During Sprint Planning
- Enable the workload view before assigning issues to see each person's current load
- Use the Remaining Estimate mode to focus on future work distribution
- Look for green cells (healthy load) when deciding who has bandwidth for new work
- Avoid assigning more issues to people already showing red (overloaded) indicators
Fixing Overloaded Days
- Identify red cells on the timeline — these indicate days where a person is over capacity
- Drag an issue bar horizontally to shift it to a less loaded day or week
- Drag an issue bar vertically to reassign it to a different team member who has availability
- Use the Availability mode to see exactly how many free hours each person has
Combining with Other Features
- Capacity schemes — set up different schedules for part-time vs full-time team members so workload calculations reflect their actual hours
- Holiday calendars — assign the correct calendar to each team or user so holidays are factored into available capacity
- Leave management — ensure leave requests are approved promptly so the workload view shows accurate availability
- Reports — use the Resource Utilization Forecast report for a detailed breakdown of team capacity over longer periods
Keep Estimates Updated
The accuracy of workload indicators depends on issues having up-to-date estimates. Encourage your team to set original estimates when creating issues and to log work regularly so remaining estimates stay current.
Need Help?
If you have questions or need assistance, our support team is here to help.
Contact Support