Overview Back to top
The Reports module provides six report templates designed to give managers and team leads clear visibility into resource utilization, project effort distribution, leave patterns, time entry details, and planned-vs-actual comparisons. Reports appear in a single card gallery; the Advanced Utilization Report is marked with a star (★) in its top-right corner to indicate it's a builder-style report that opens directly into a self-configurable view, while the others use a pre-run configuration dialog. Reports are accessed from the Reports view in the main navigation.
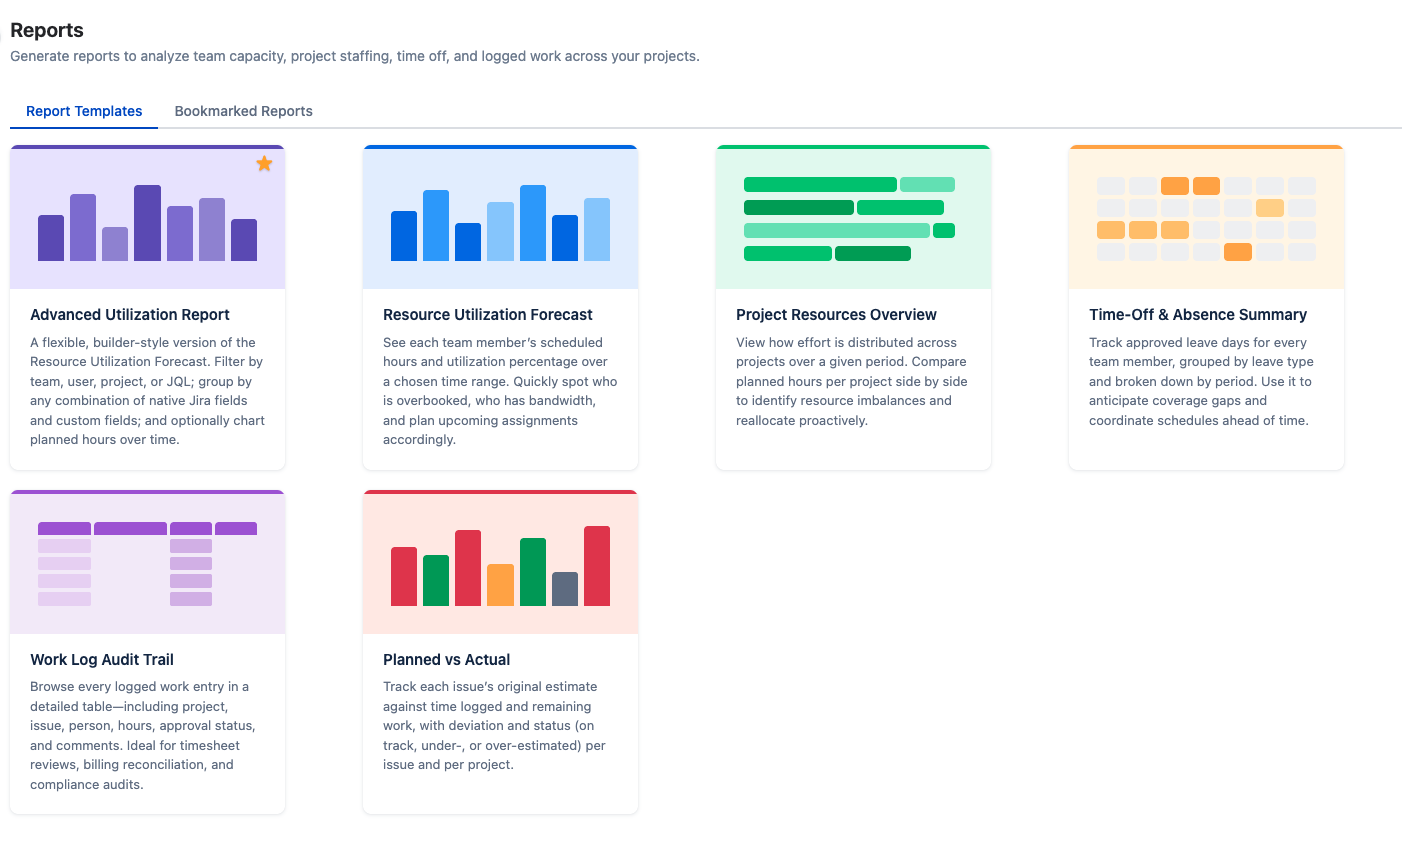
The Reports view is organized into two tabs:
- Report Templates — a card-based gallery showing the six available report types. Click any card to open the report.
- Bookmarked Reports — saved report configurations that you can re-run with a single click, without re-entering parameters each time.
Report Templates
Each report template is shown as a visual card with an illustration and brief description. Select a template to open the configuration dialog, where you set the date range, scope, grouping, and filters before generating the report.
Sorting Results
Every report's result table has clickable sortable column headers. Click a column header to sort ascending; click again to reverse. Hierarchical reports (Project Resources, Planned vs Actual, Utilization Forecast with team grouping) keep their parent groupings intact — sorting applies within each group. The Worklog Report defaults to Date descending (newest first); other reports default to a sensible name/key column. To narrow the data shown, use the configuration dialog's user, team, and project filters before generating the report.
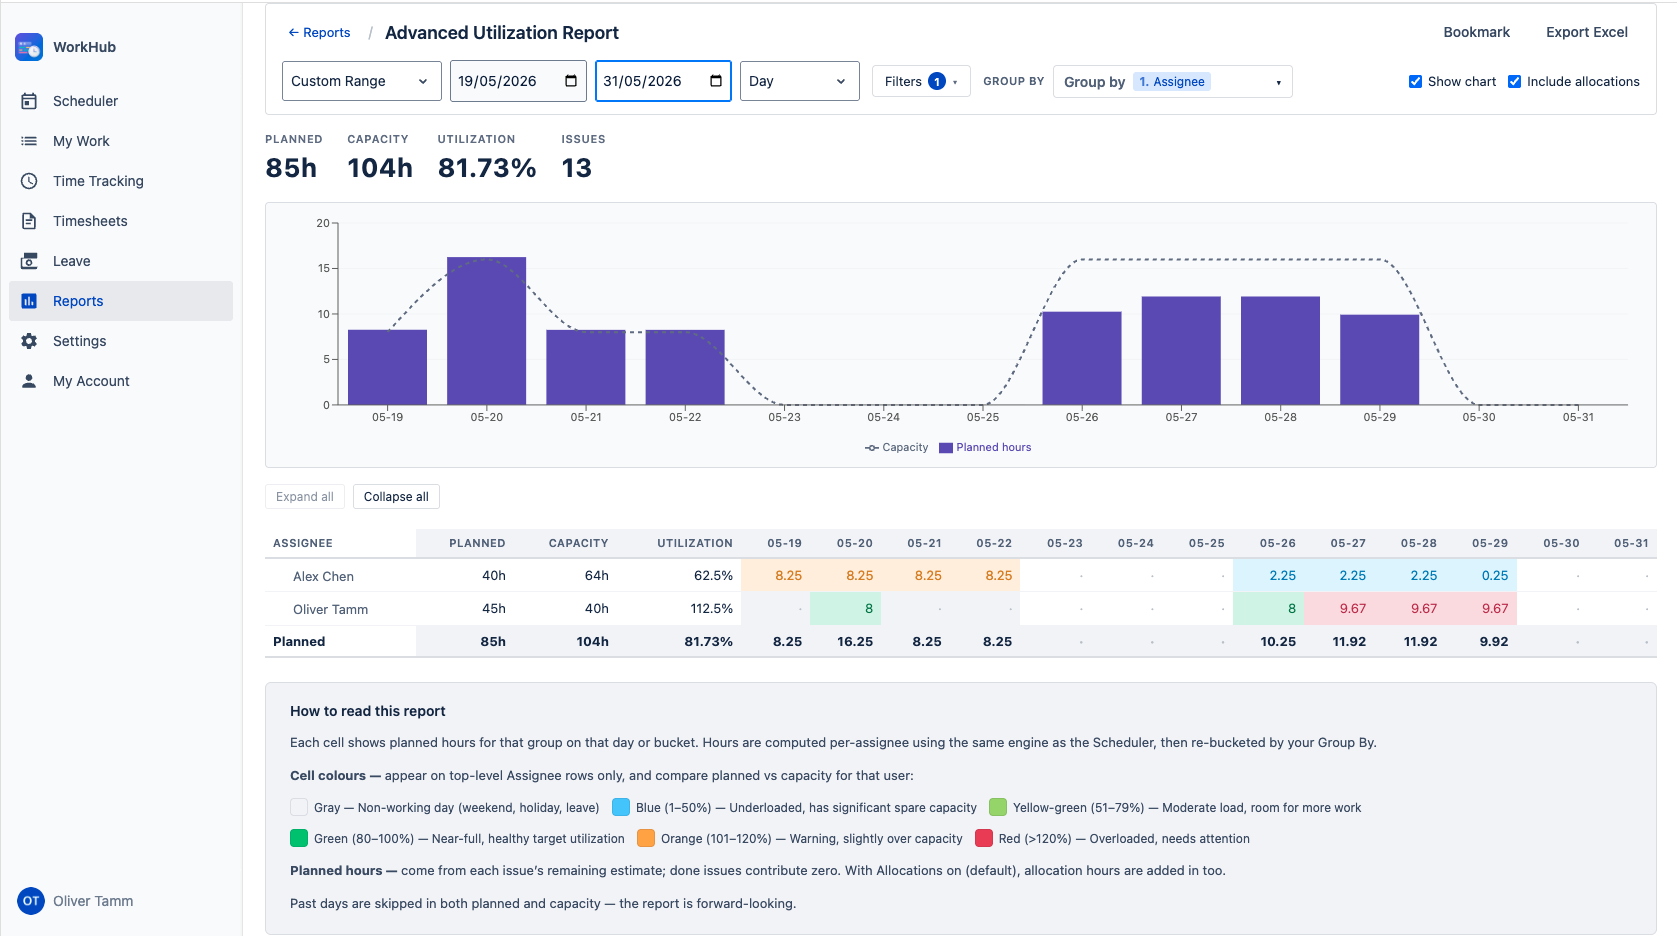
Advanced Utilization Report Back to top
The Advanced Utilization Report is the flexible, builder-style cousin of the Resource Utilization Forecast. You pick your own filters, your own grouping (any combination and order of native Jira fields plus custom fields), and choose whether to render a chart of planned hours over time. Clicking its card opens the report immediately — all filters and configuration live in the report's own header.
How the numbers are calculated — read this first
The numbers in this report come from the same per-assignee workload engine that powers the Scheduler's workload indicators and the Resource Utilization Forecast. Grouping and filtering only re-shape and narrow that data — they never change what an individual hour represents.
For each user in scope, for each day in the period, the engine computes:
- Capacity hours — the user's working-hour schedule for the day, minus full-day holidays and full-day approved leaves. Partial leaves reduce the day's capacity by the hours taken off. Weekends produce 0 capacity.
- Planned hours — each Jira issue's estimate (remaining or original, following the site-wide Workload basis) evenly distributed across its own working days, attributed to its assignee. If Include allocations is on, allocation
hoursPerDayis added on every day the allocation covers (full hours on partial-leave days, 0 on full-day-leave / holiday / weekend days). - Per-user totals are then rolled up into the columns picked by Scope (Day / Week / Month) for the visible period.
Filtering (Jira filter / team / user / project) narrows which issues are fed into the engine. Grouping then re-buckets the per-user-per-day numbers for display. Both happen after the per-user numbers are computed, so the totals stay consistent: every hour in this report is "user U's expected work on day D," computed exactly once per (user, day) the same way the Scheduler does it. Configured for the same period and filters, the Forecast and Advanced reports always agree on per-user totals.
Filters (open the Filters button in the header)
- Jira filter: pick any saved Jira filter you have access to. The picker shows your favourites by default and supports search. Combines (ANDs) with the other filters below.
- Teams, People, Projects: same pickers as other reports. Each narrows the issue set; combinations compose as AND.
- Period: pick a relative range (this week, next 4 weeks, current month/quarter, etc.) or set a custom date range from the toolbar.
- Scope: switch between Day / Week / Month columns from the toolbar.
Changes inside the Filters panel are staged until you click Apply; Cancel or clicking outside discards them. The same draft & Apply pattern applies to the Group By picker.
Group by — multi-level builder
Open the Group By chip list in the header to assemble an ordered list of grouping levels — e.g. Project → Assignee → Sprint → Epic. Pick from two sections:
- Jira Fields: Project, Assignee, Reporter, Status, Priority, Issue Type, Parent/Epic, Issue, Resolution, Labels, Components, Fix Versions.
- Custom Fields: every groupable custom field on your Jira site (single-select, multi-select, user picker, version picker, etc.). Free-text, number, and date custom fields are intentionally excluded — their values are continuous, so grouping by them would produce one bucket per issue.
Drag chips to reorder levels, click × to remove. Up to 6 levels at once. Reorder and removal are local-only; adding a new field that isn't already on the issue payload triggers one re-fetch so the resolver can return its values.
Chart
Toggle Show chart in the header toolbar to render a planned-hours-per-bucket bar chart above the tree, with a dashed capacity overlay line. The chart reflects the full filter scope — not just the expanded tree nodes. The capacity line is only drawn when the top-level grouping is Assignee, because that's the only case where "capacity" has a clean denominator (sum of per-user capacities). Under any other grouping the bar still shows total planned hours, but the line is hidden — the totals tile above the chart still carries the team-aggregate capacity figure.
Allocations
Toggle Include allocations in the header to include allocation hours (matches the Resource Utilization Forecast's default). When on, allocations bucket under their linked target when grouping by Project / Parent (Epic) / Assignee:
- PROJECT-target: hours show under that project.
- EPIC-target / ISSUE-target: hours show under the linked epic / issue's project (and under the epic itself when grouping by Parent).
- CUSTOM CATEGORY: hours show under “(No value)” for project/epic groupings (categories don't have a Jira project), and under the assignee when grouping by Assignee.
With a project filter active, only allocations belonging to the filtered projects are counted; custom-category allocations are excluded.
Cell colours, leave cells, and past days
- Top-level assignee rows use the same capacity-aware colour palette as the Forecast (underloaded / moderate / balanced / warning / overloaded). Nested rows under another grouping (e.g. Project → Assignee) intentionally stay uncoloured because the per-row denominator would be ambiguous.
- Vacation cells are styled as non-working (grey, no number) on assignee rows whenever every working day in the bucket is fully on leave for that user.
- Past days are dropped from both numerator and denominator — the report is forward-looking. Today is included.
Per-row Capacity & Utilization columns
When the top-level grouping is Assignee, the tree gains two extra columns next to Planned: Capacity (total available hours for that user over the period, after holidays and leaves) and Utilization (planned ÷ capacity, as a percentage). These match what the Resource Utilization Forecast shows per user. Under any other top-level grouping (Project, Status, etc.) the columns are hidden — "capacity" is only well-defined per-user, so showing it for a project or label row would be misleading. The grand total row at the bottom of the table carries the team-aggregate capacity and utilization the same way.
Bookmarking & export
Bookmark from the header to persist the period, scope, filters, grouping, Jira filter id, allocations toggle, and chart toggle. Periods are relative tokens (e.g. "Current Quarter"), not frozen dates — opening a bookmark next quarter shows that quarter. Use the Custom Range period to freeze the dates explicitly. The Excel export produces a single sheet matching the on-screen tree (indented hierarchy, capacity colours, leave cells blank, and the Capacity / Utilization columns when grouped by Assignee), named advanced_utilization_<from>_<to>.xlsx.
Utilization Forecast Back to top
The Utilization Forecast report shows per-person remaining workload from today forward. It compares each team member's available capacity against their remaining scheduled work to calculate a utilization rate.
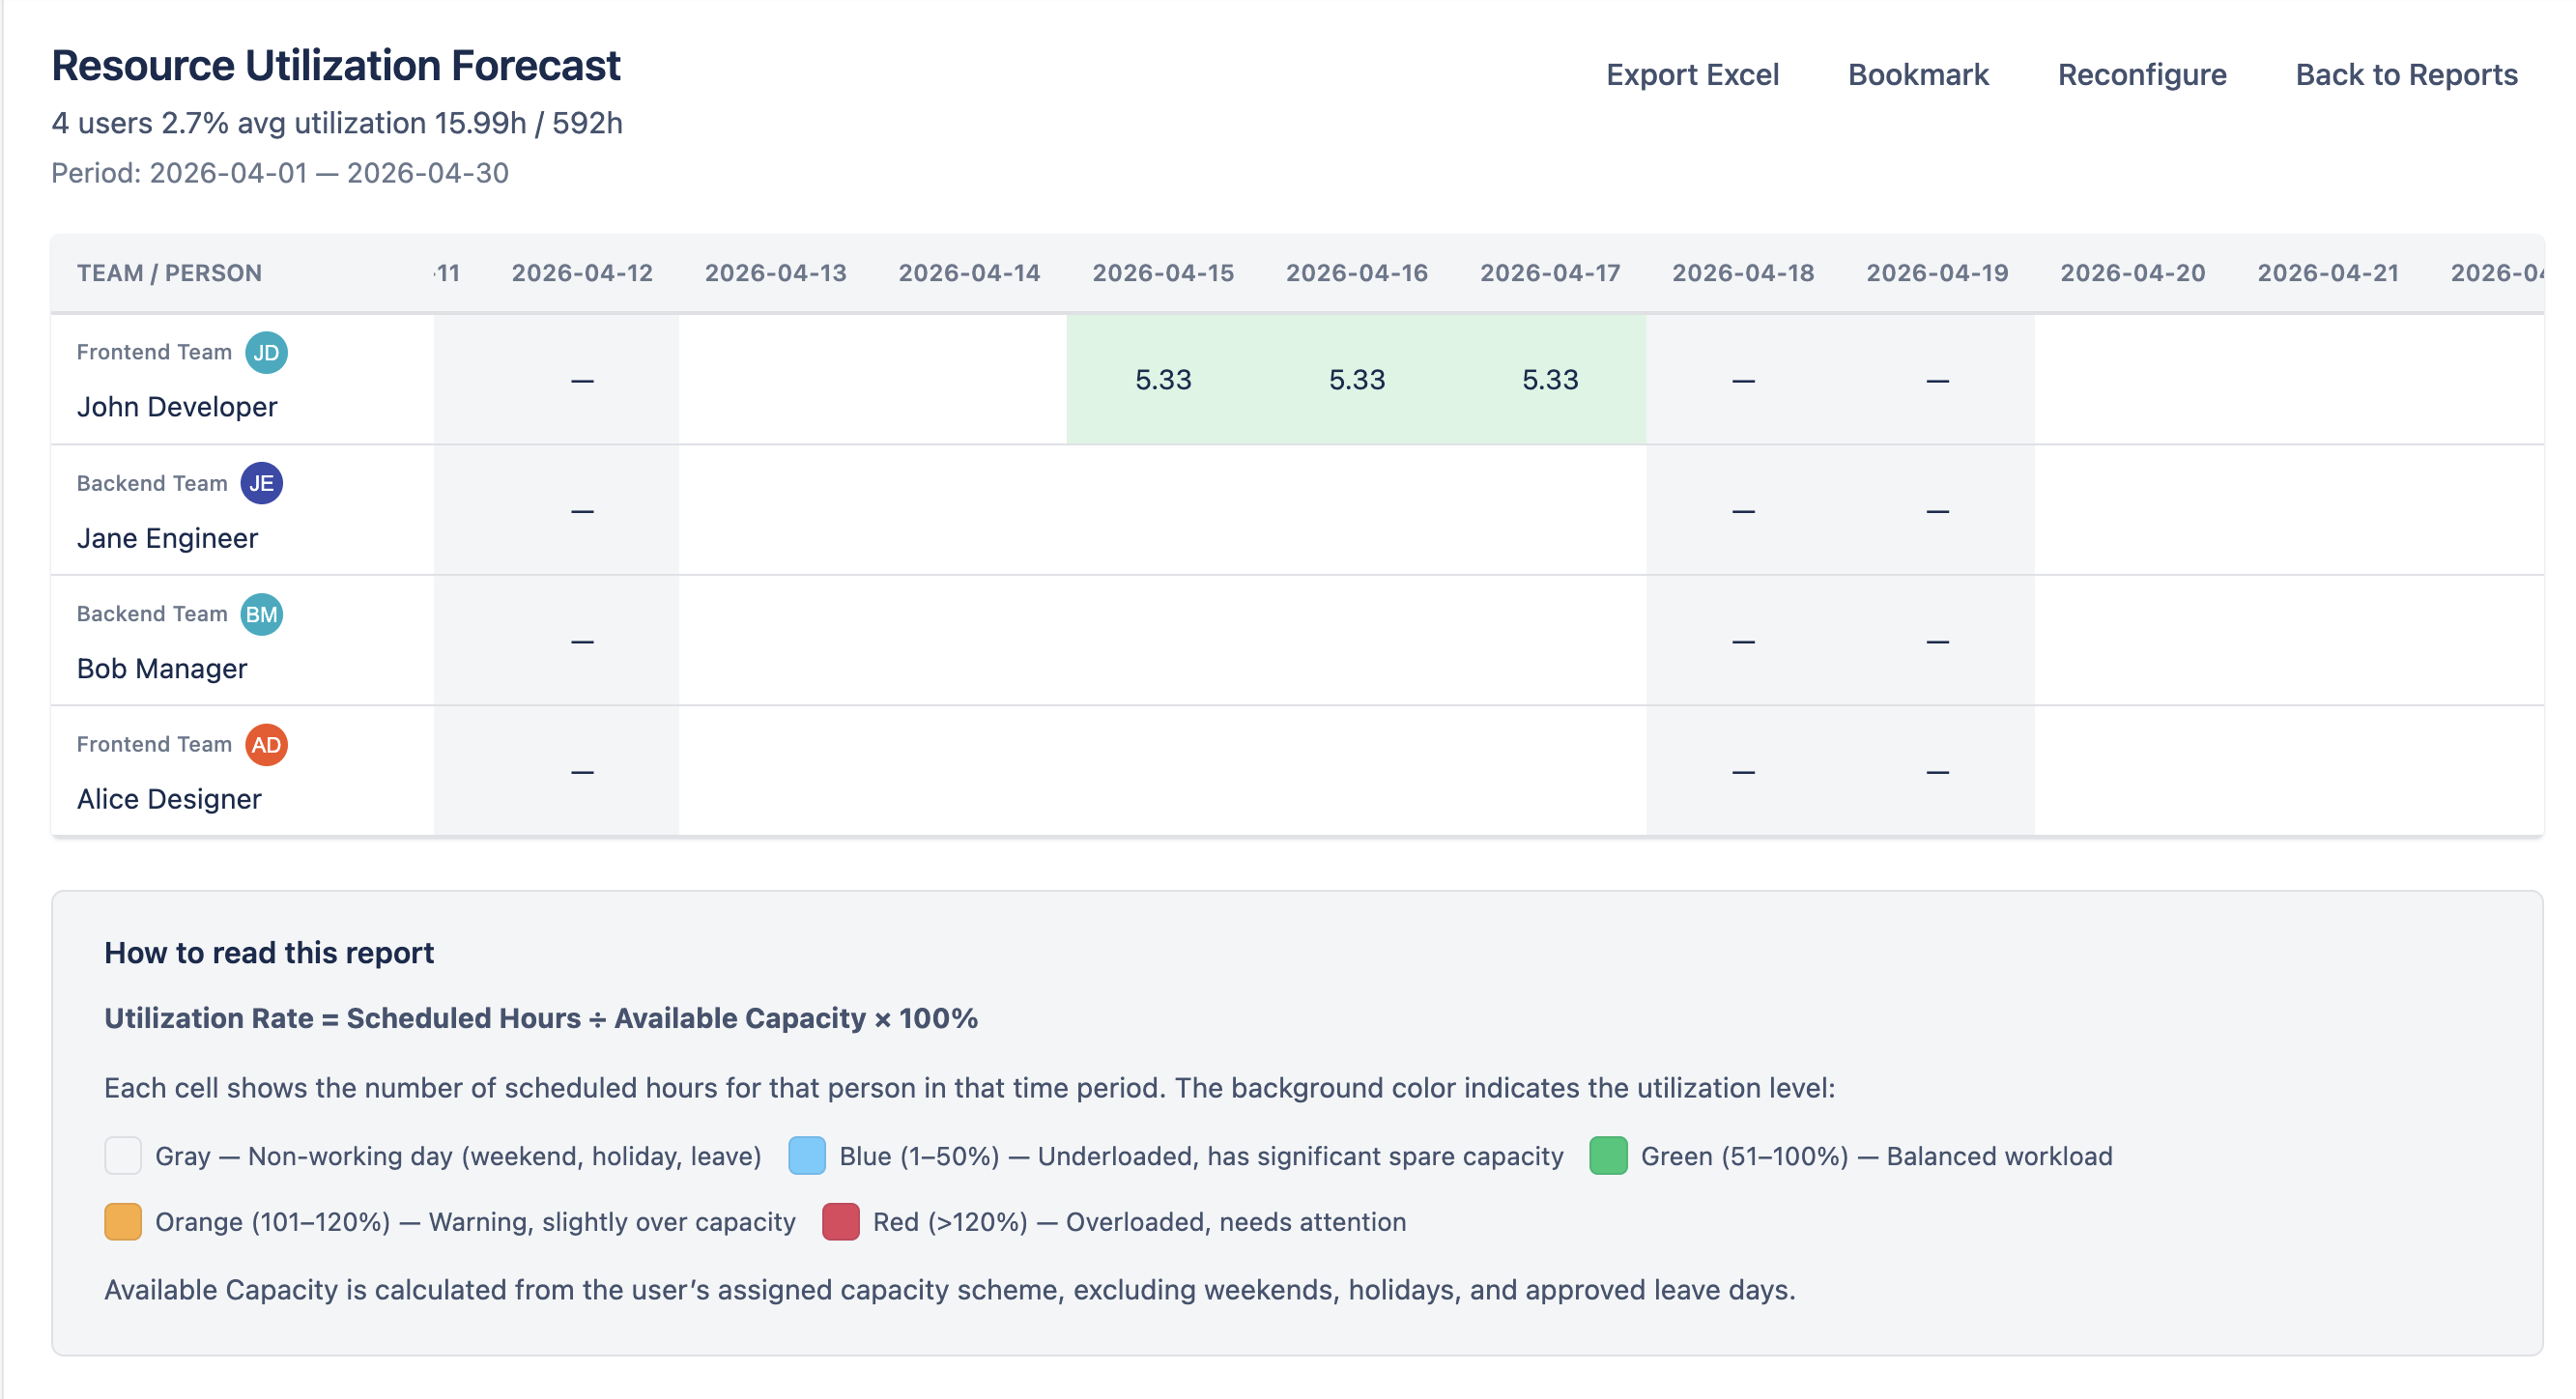
Columns
- Person — the team member's name and avatar.
- Total Available — the total available working hours within the selected period, based on their capacity scheme and excluding holidays and approved leave.
- Utilized — total remaining estimate hours distributed across working days from today forward. Done issues contribute 0 hours. Uses the Jira remaining estimate field.
- Rate (%) — utilization percentage calculated as Utilized / Total Available × 100.
Row Tiers
Results are rendered in up to four nested tiers:
- Grand total — sum across all users in scope. Hidden when only one team is shown (the team summary already covers it).
- Team summary — one row per team aggregating its users. Users not on any selected team appear under a synthetic Without Team group.
- User row — per-person totals and per-day cells.
- Grouping children — only when Group by is set to Project, Epic, or Issue (see below). Each child row shows the user's utilization for one project / epic / issue.
Group by
Adds an extra row tier under each user, splitting their utilization by where the work is going. The percentage on a child row divides the child's hours by the user's total capacity, so child percentages can sum to less than 100% (the rest is uncategorized capacity, leave, or holidays).
- None — flat user rows, no per-grouping breakdown.
- Project — one child row per Jira project the user has work on, labeled
[KEY] Project Name. - Epic — one child row per epic, labeled
[ISSUE-KEY] Epic summary. Sub-tasks of stories without an epic link bucket under Without Epic. - Issue — one child row per issue, labeled
[KEY] Summary.
Allocations whose target matches the chosen grouping (PROJECT-target with Project, EPIC-target with Epic, ISSUE-target with Issue) appear in their own row with a (allocation) suffix so you can tell allocated time apart from the project's direct issue work. Custom-category allocations always show as Custom: <name> regardless of group mode.
Display per-day cells as
- Hours (default) — each per-day cell shows scheduled hours.
- Percentage — each cell shows
scheduled / effective capacity × 100, where effective capacity is the day's working hours minus any leave. Cells on weekends, holidays, or days fully consumed by leave stay blank in either mode. Summary columns (Total Available, Utilized, Rate) always remain in hours / percentage as appropriate.
Include allocations
Checkbox, default on. When checked, allocations contribute to scheduled hours and (with grouping) to per-grouping rows. Uncheck to see only work scheduled via Jira issues, ignoring all allocation bookings.
Project Resources Back to top
The Project Resources report shows remaining effort distributed across your Jira projects. Each project is displayed as a top-level row, with per-person sub-rows showing how the remaining work breaks down by team member.
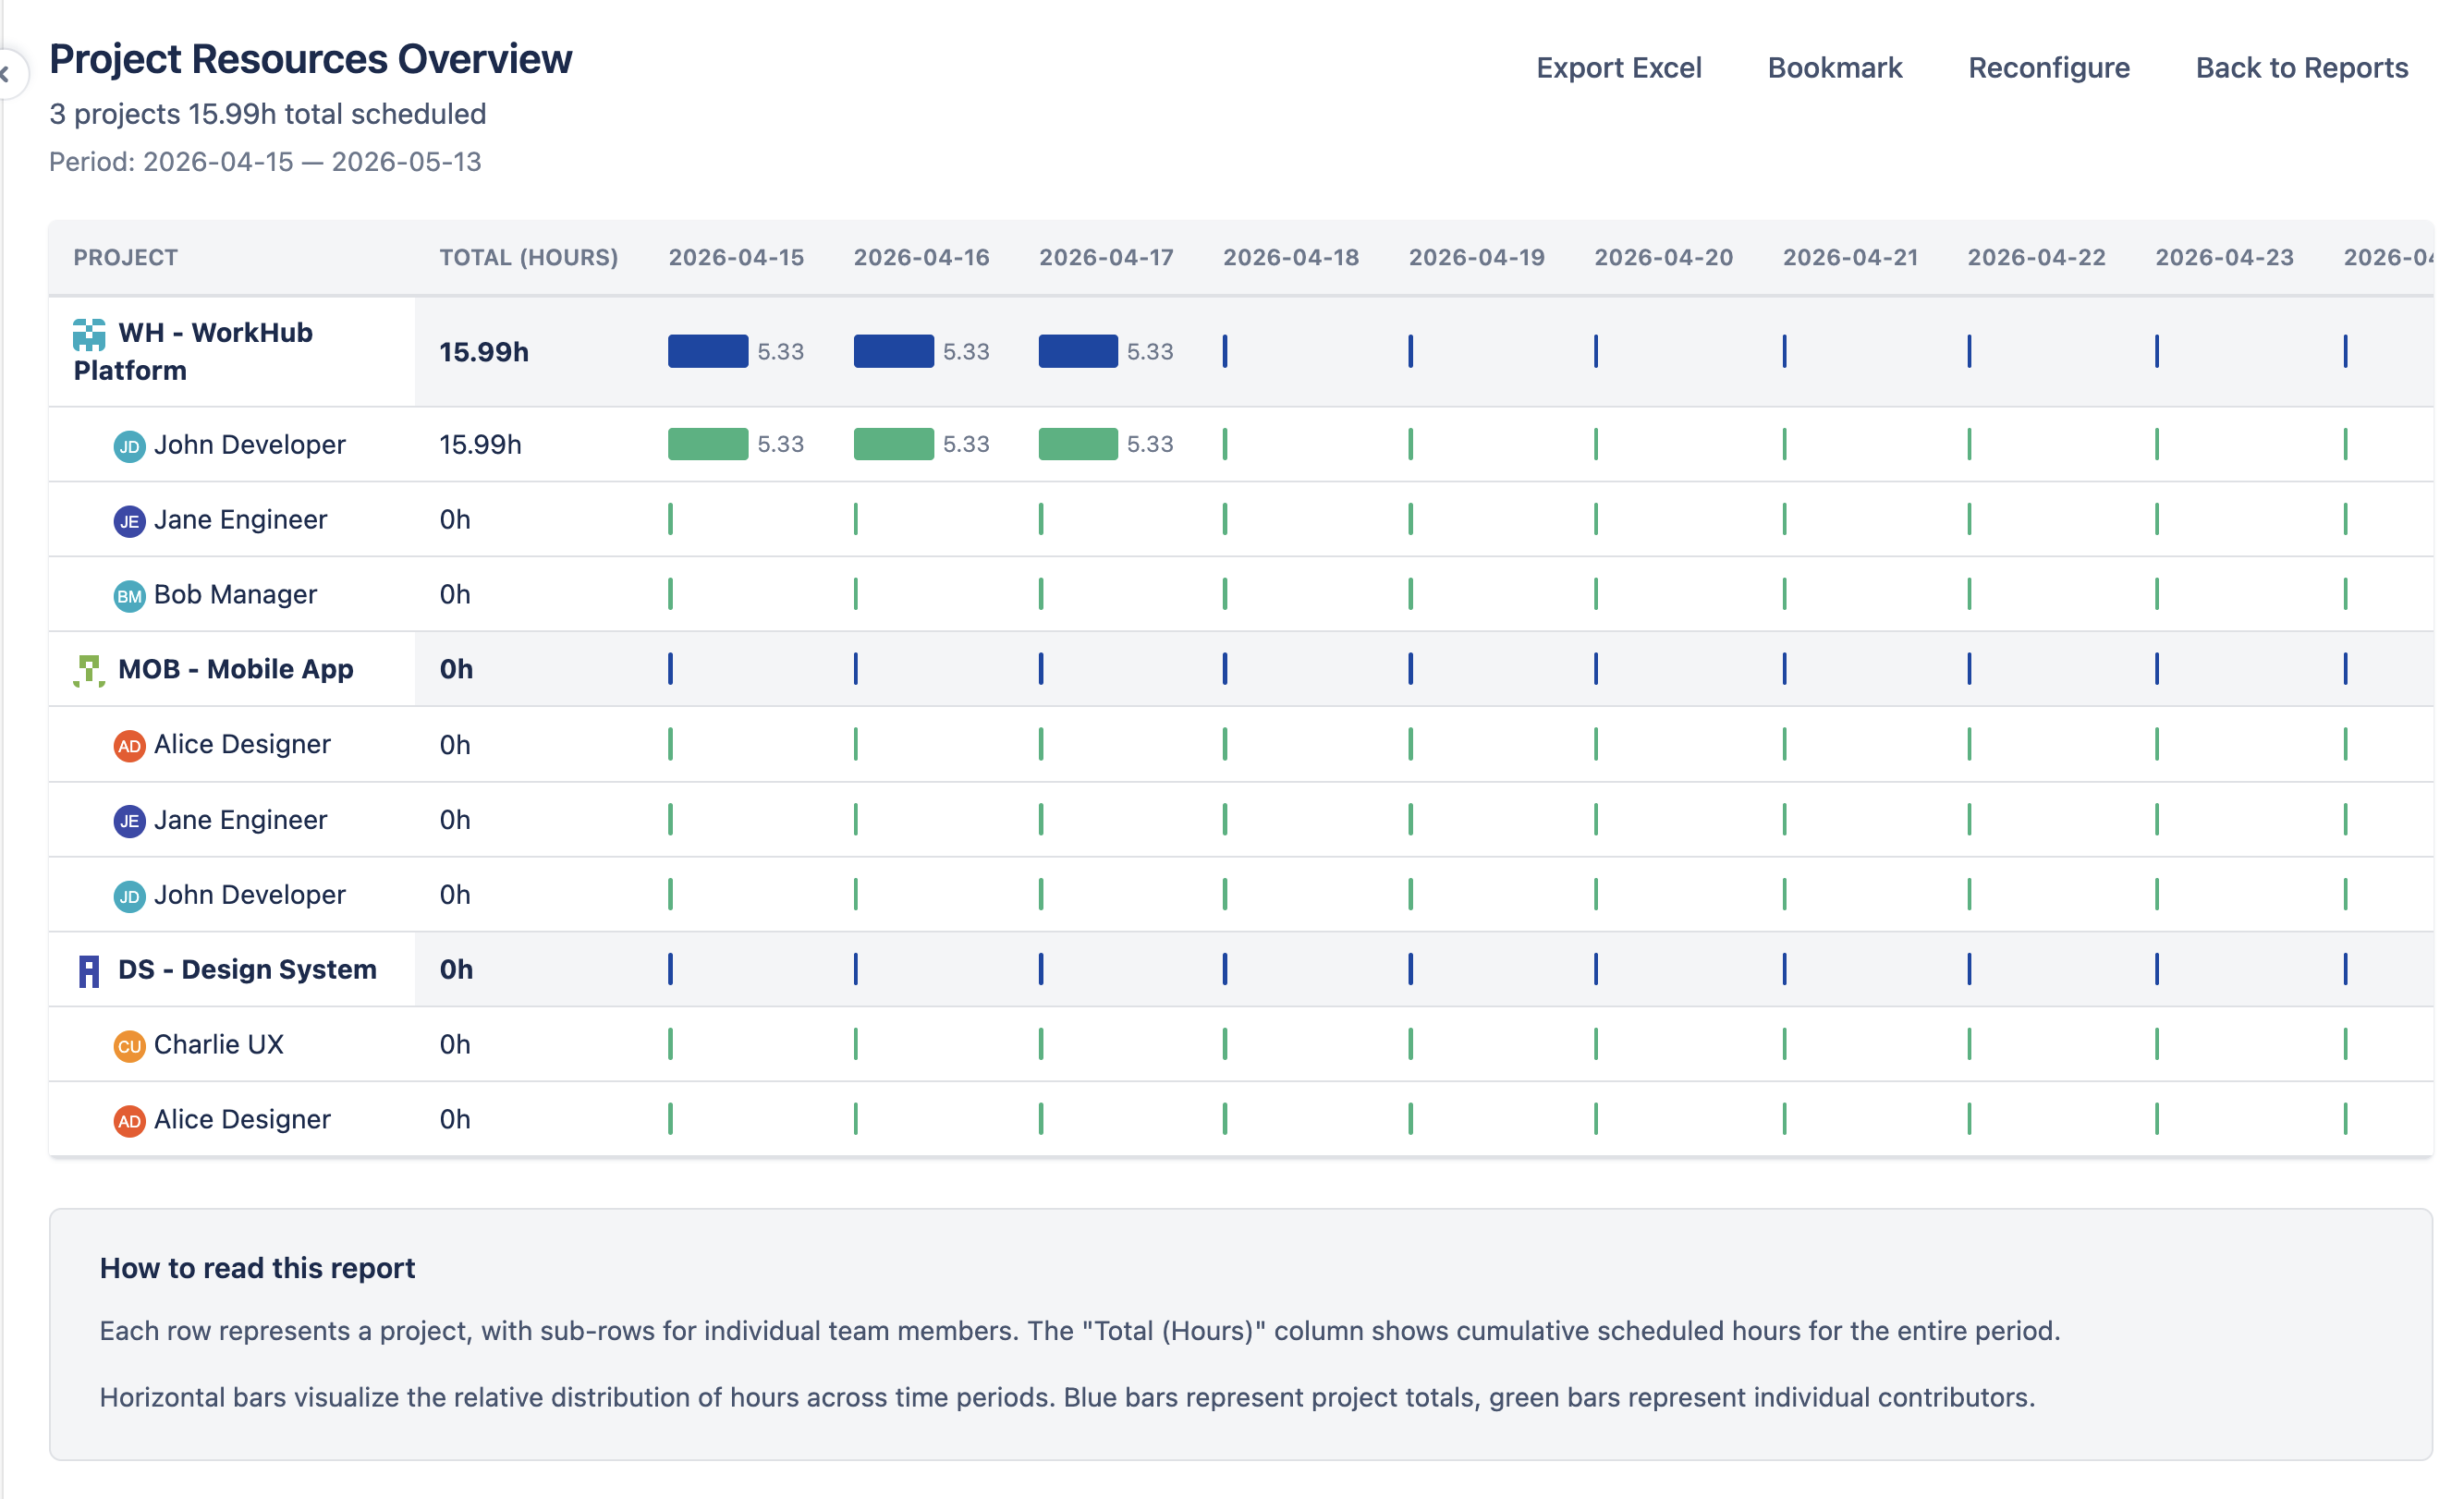
How It Works
- Each Jira project with scheduled issues or allocations appears as a top-level row.
- Each project expands into per-person sub-rows showing how that project's hours break down by team member.
- Hours shown represent the remaining estimate for each person within the project, distributed across the selected period's working days, plus any allocation bookings (see Include allocations below).
- Date columns reflect the configured scope (day, week, or month).
Include allocations
Checkbox, default on. When checked, allocation bookings contribute to project hours alongside the remaining-estimate distribution from Jira issues. PROJECT-target allocations bucket under that project; ISSUE-target and EPIC-target allocations bucket under the issue's project. Uncheck to see project hours from Jira issues only — projects that have only allocations (no scheduled issues) will not appear when this is unchecked.
Use Case
Use this report to understand how your team's effort is spread across projects. Identify projects that are consuming more resources than planned, or find team members who may be stretched across too many projects simultaneously.
Leave Report Back to top
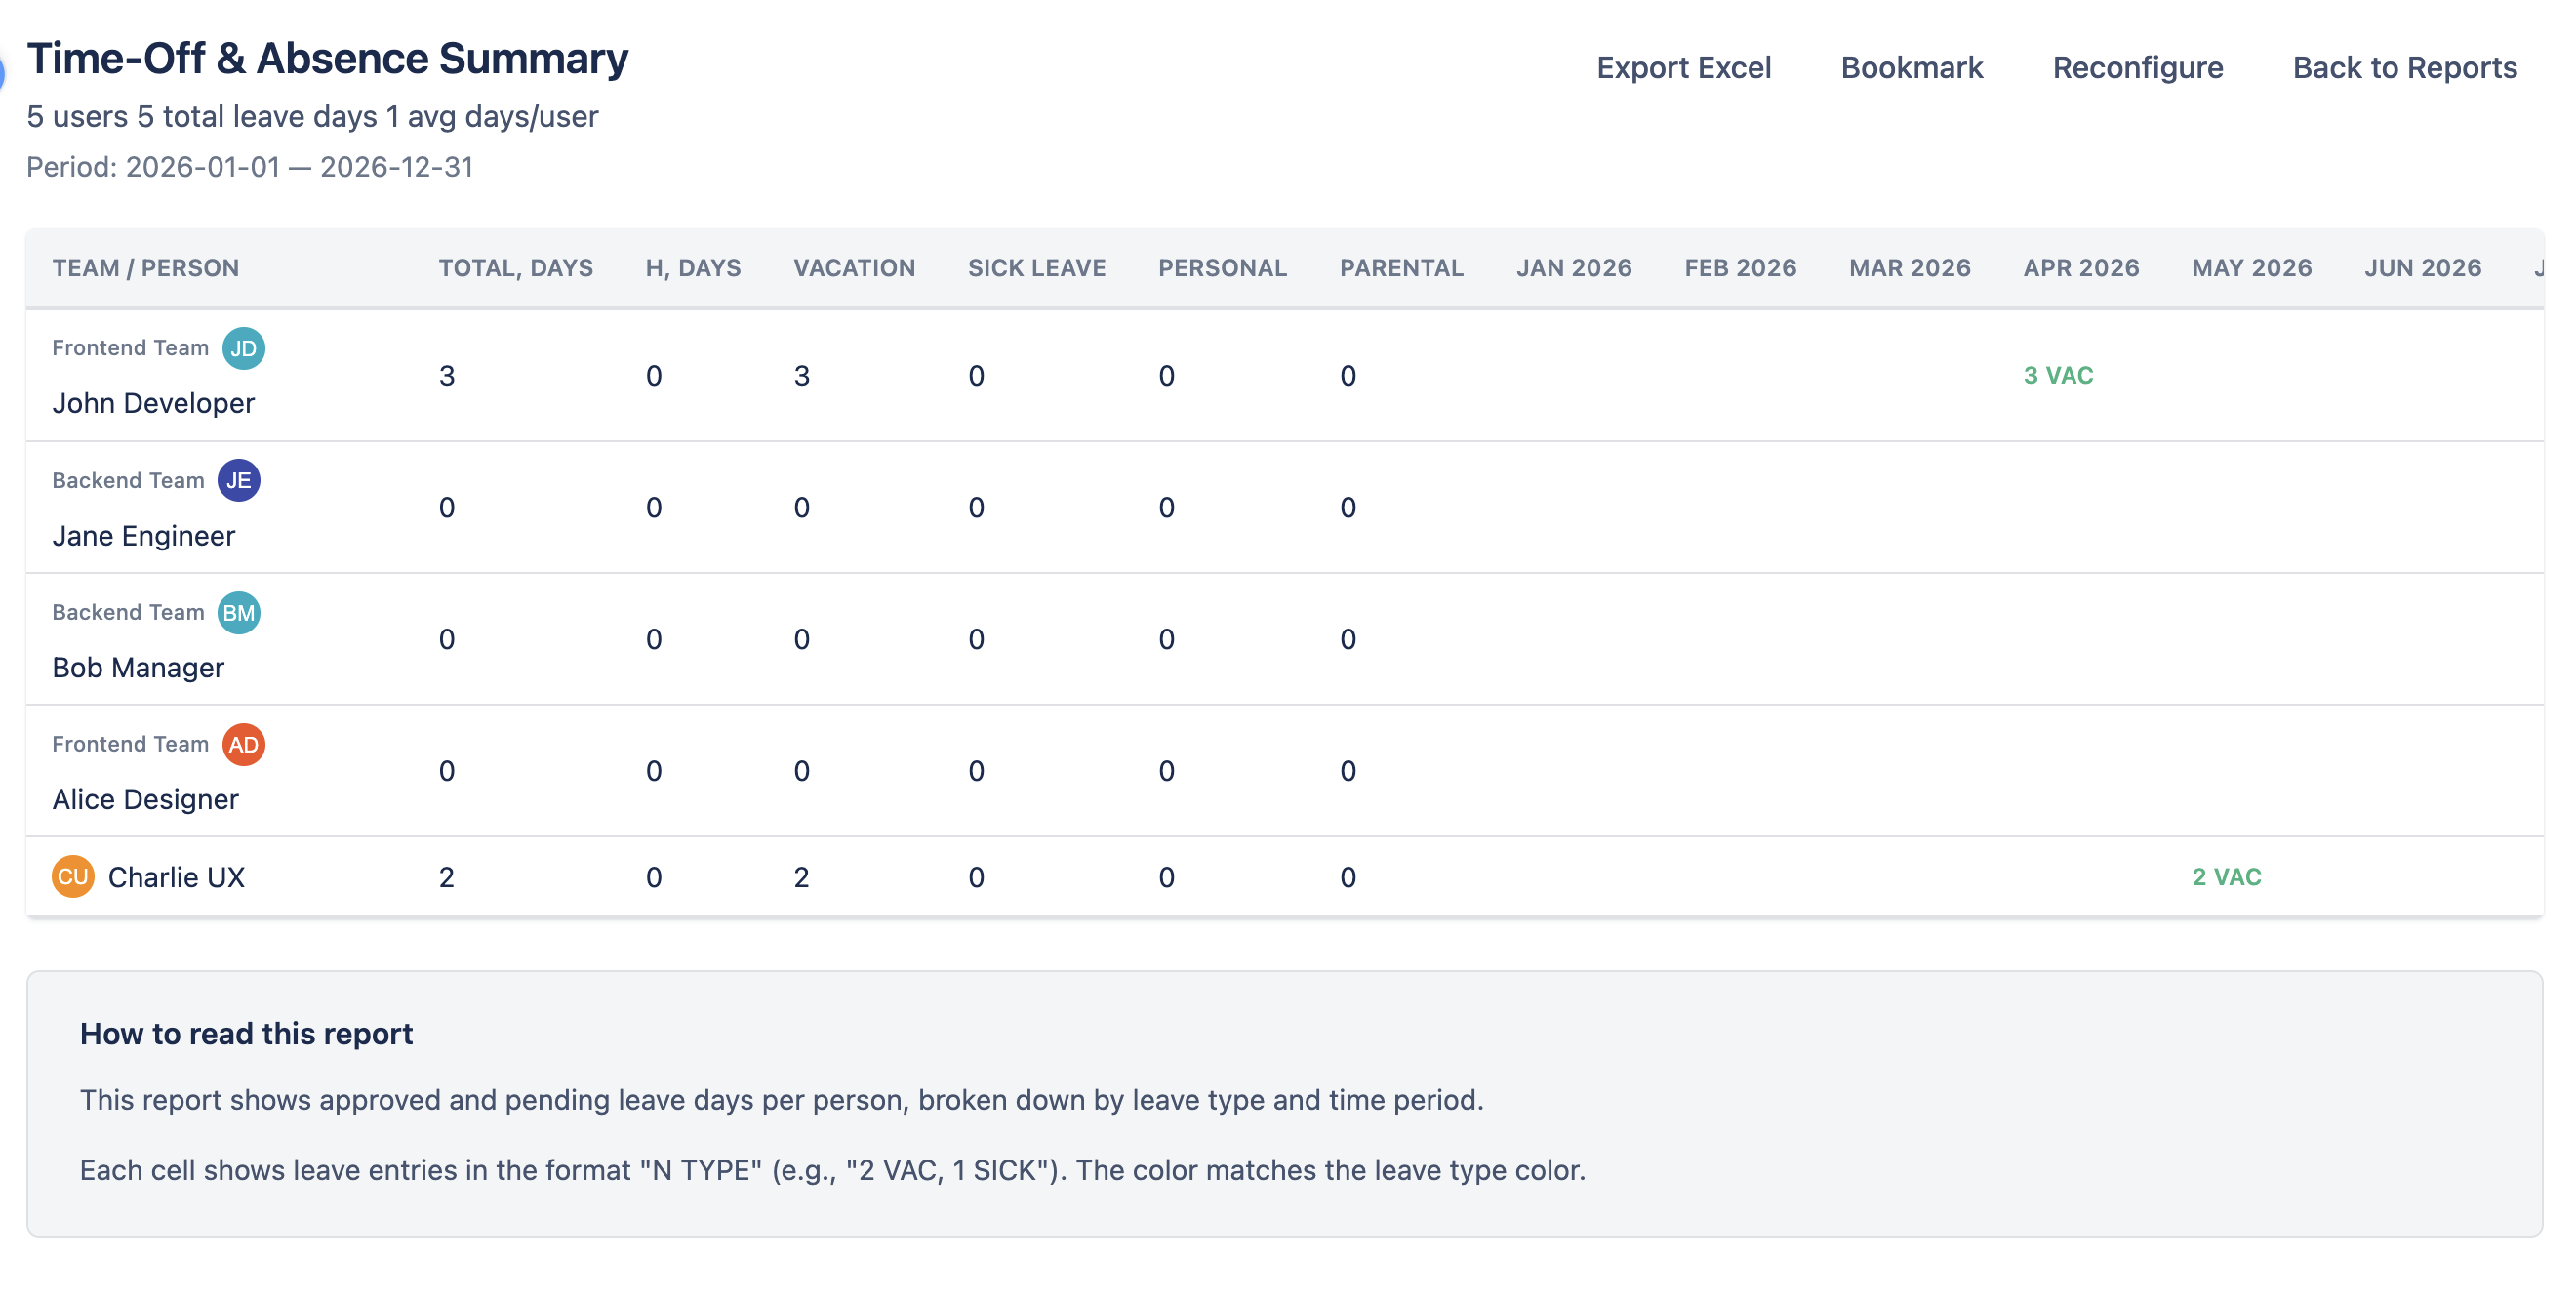
The Leave Report provides a summary of approved leave days per person within the selected period. It breaks down time off by leave type so you can see how different categories of absence impact team availability. Grouping by Team in the configuration dialog organises the rows into per-team sections with a leave-days subtotal for each team, on screen and in the Excel export.
Columns
- Person — the team member's name and avatar.
- Total — total number of approved leave days in the period.
- Holidays — public holidays from assigned holiday calendars that fall on the person's working days within the period.
- Leave type columns — one column per configured leave type (e.g., Vacation, Sick Leave, Personal, Parental), showing the number of days taken for each type.
- Date columns — columns for each date period (day, week, or month depending on scope), showing leave days per period.
Worklog Report Back to top
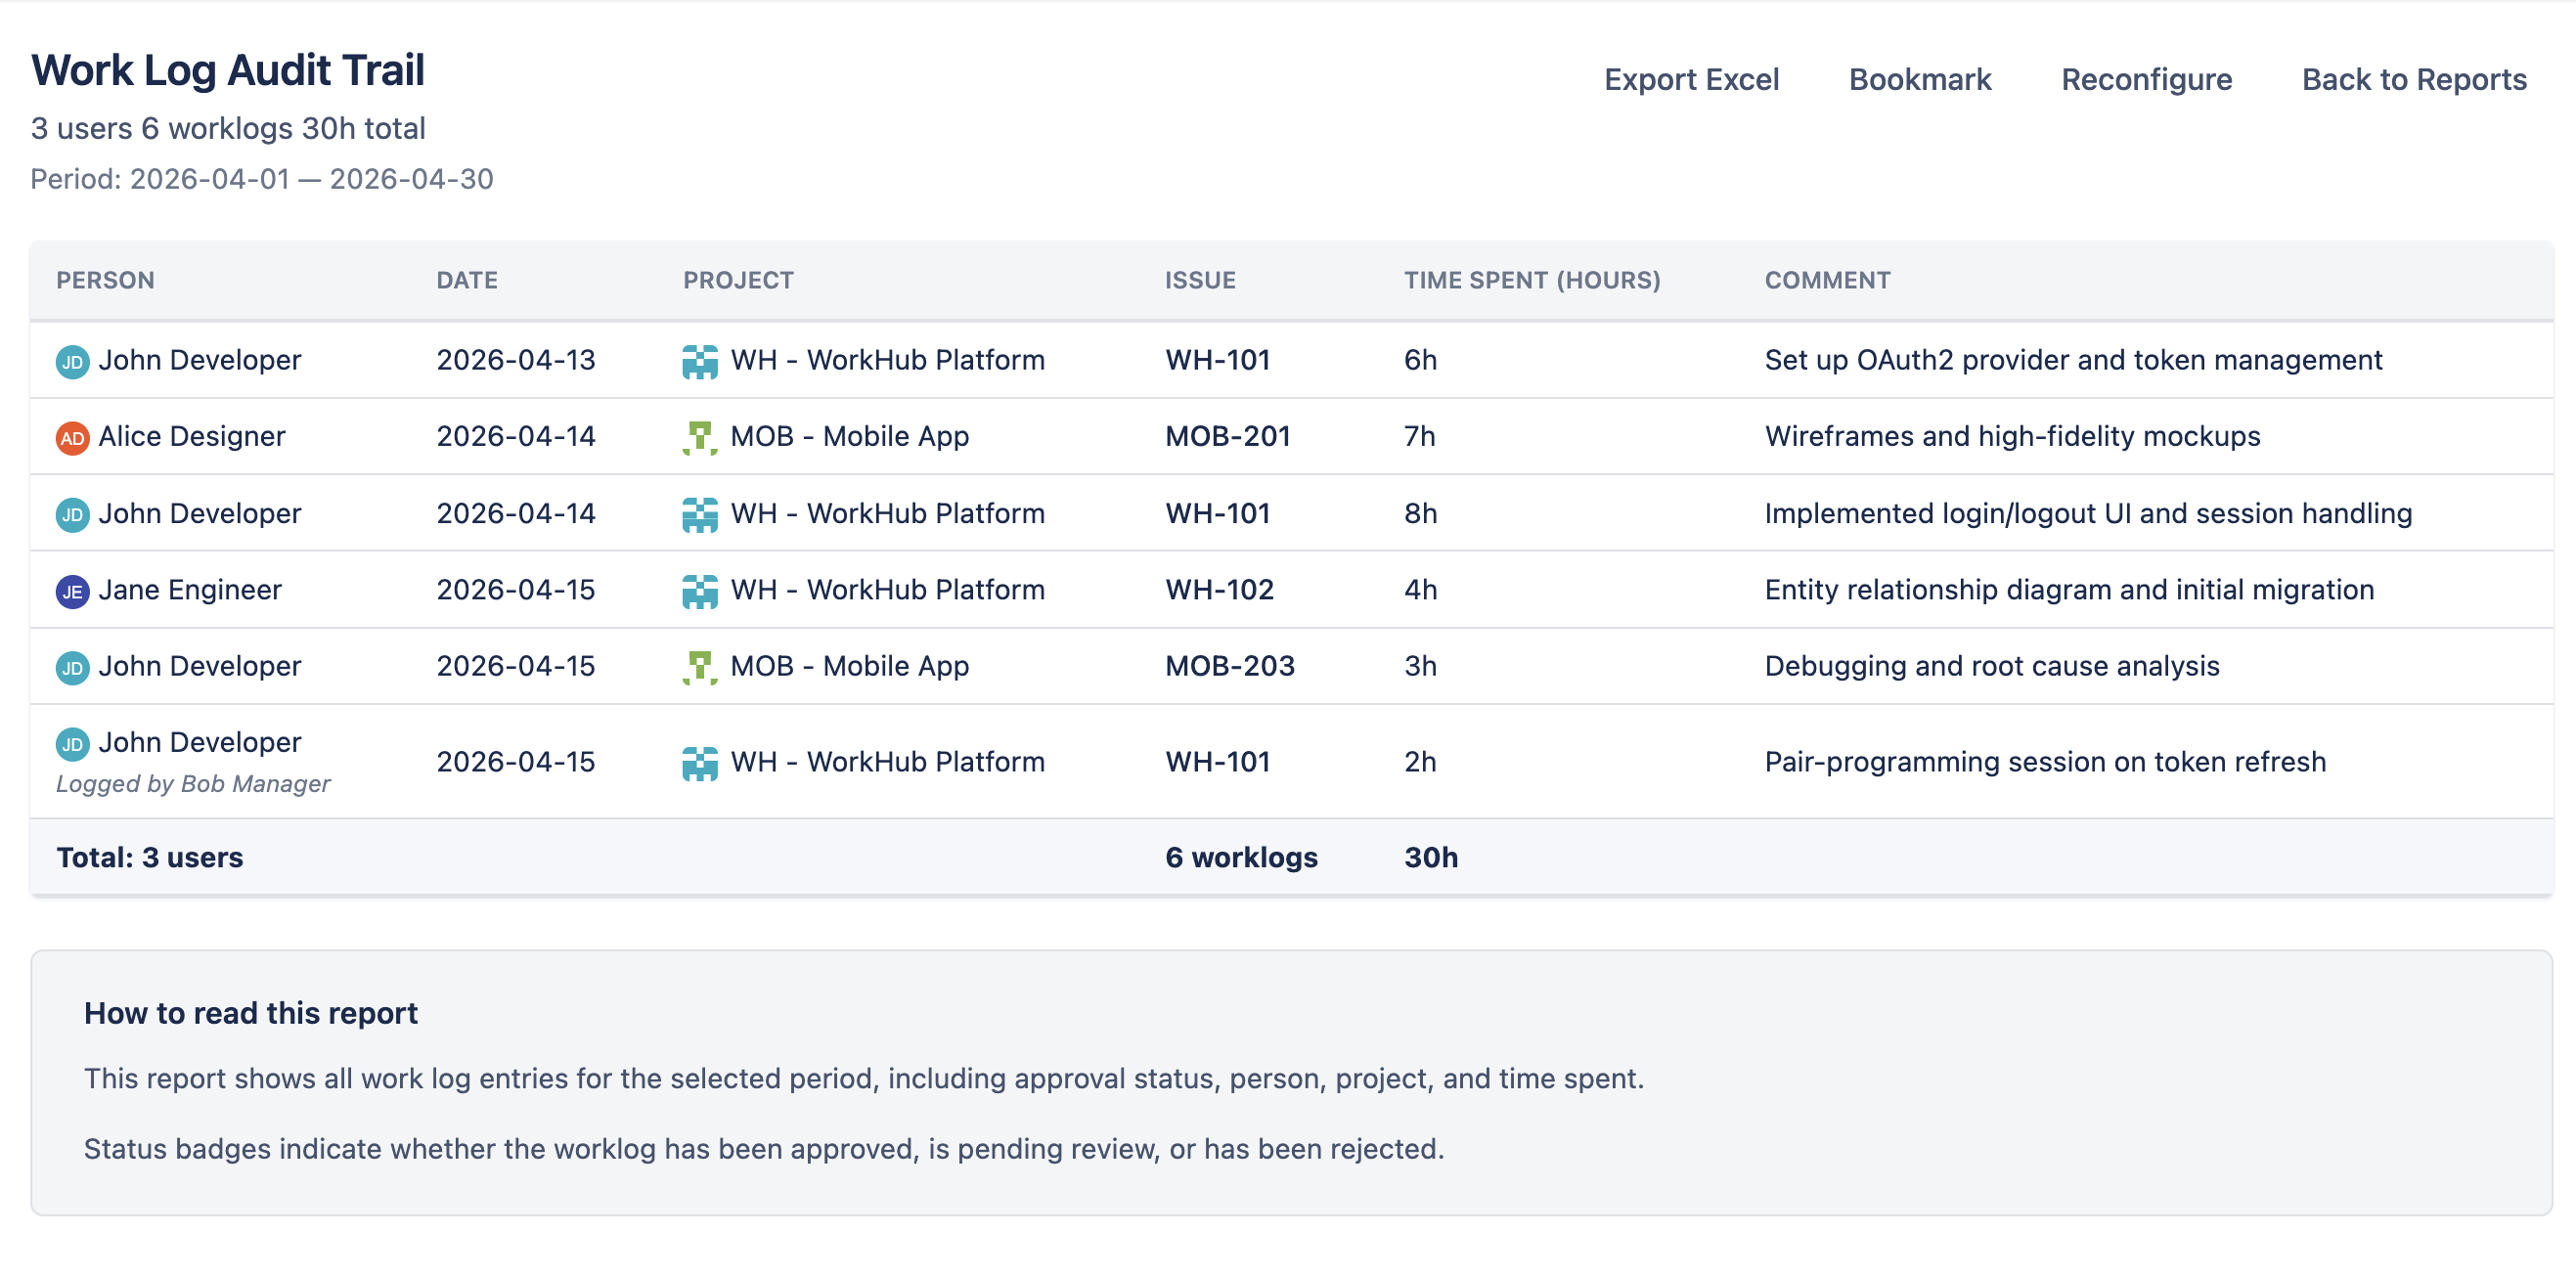
The Worklog Report displays every worklog entry within the selected period as an audit trail. It provides a detailed view of who logged time, on which issues, and how much. Grouping by Team in the configuration dialog organises entries into per-team sections with an hours subtotal for each team, on screen and in the Excel export.
Columns
- Status — the timesheet approval status for the worklog's period (only shown when timesheet approval is enabled in Settings).
- Approved By — the reviewer who approved the worklog's timesheet period; empty until the period is approved (only shown when timesheet approval is enabled in Settings).
- Person — the user who logged the time entry.
- Date — the date the work was performed.
- Project — the Jira project the issue belongs to.
- Issue — the Jira issue key (e.g., WH-42) followed by its summary text.
- Category — the worklog category (e.g. Billable, Non-Billable). Only shown when more than one category is configured; entries with no explicit category fall back to the default. Included in the Excel export.
- Time Spent — hours logged in the worklog entry. Displayed as
Xh Ymin the web view (e.g.,5h 30m,15m,5h); kept as a numeric value in Excel exports for sorting and aggregation. - Comment — optional description entered with the worklog.
Sorting
Click the Person, Date, or Project column header to sort. Click again to reverse the order. The default sort is Date descending (newest first).
Allocation worklogs
The configuration dialog has an Include allocations checkbox (enabled by default). When ticked, time logged against allocations (categories like Meetings, Support, etc.) is included alongside Jira issue worklogs. Allocation rows show Allocation in the Project column and the allocation target in the Issue column. Untick to limit the report to Jira issue worklogs only.
Filtering
Use the configuration dialog's filter options to narrow the worklog report to specific users, projects, or date ranges. This is useful for generating focused time reports for client billing, sprint reviews, or individual performance tracking.
Planned vs Actual Back to top
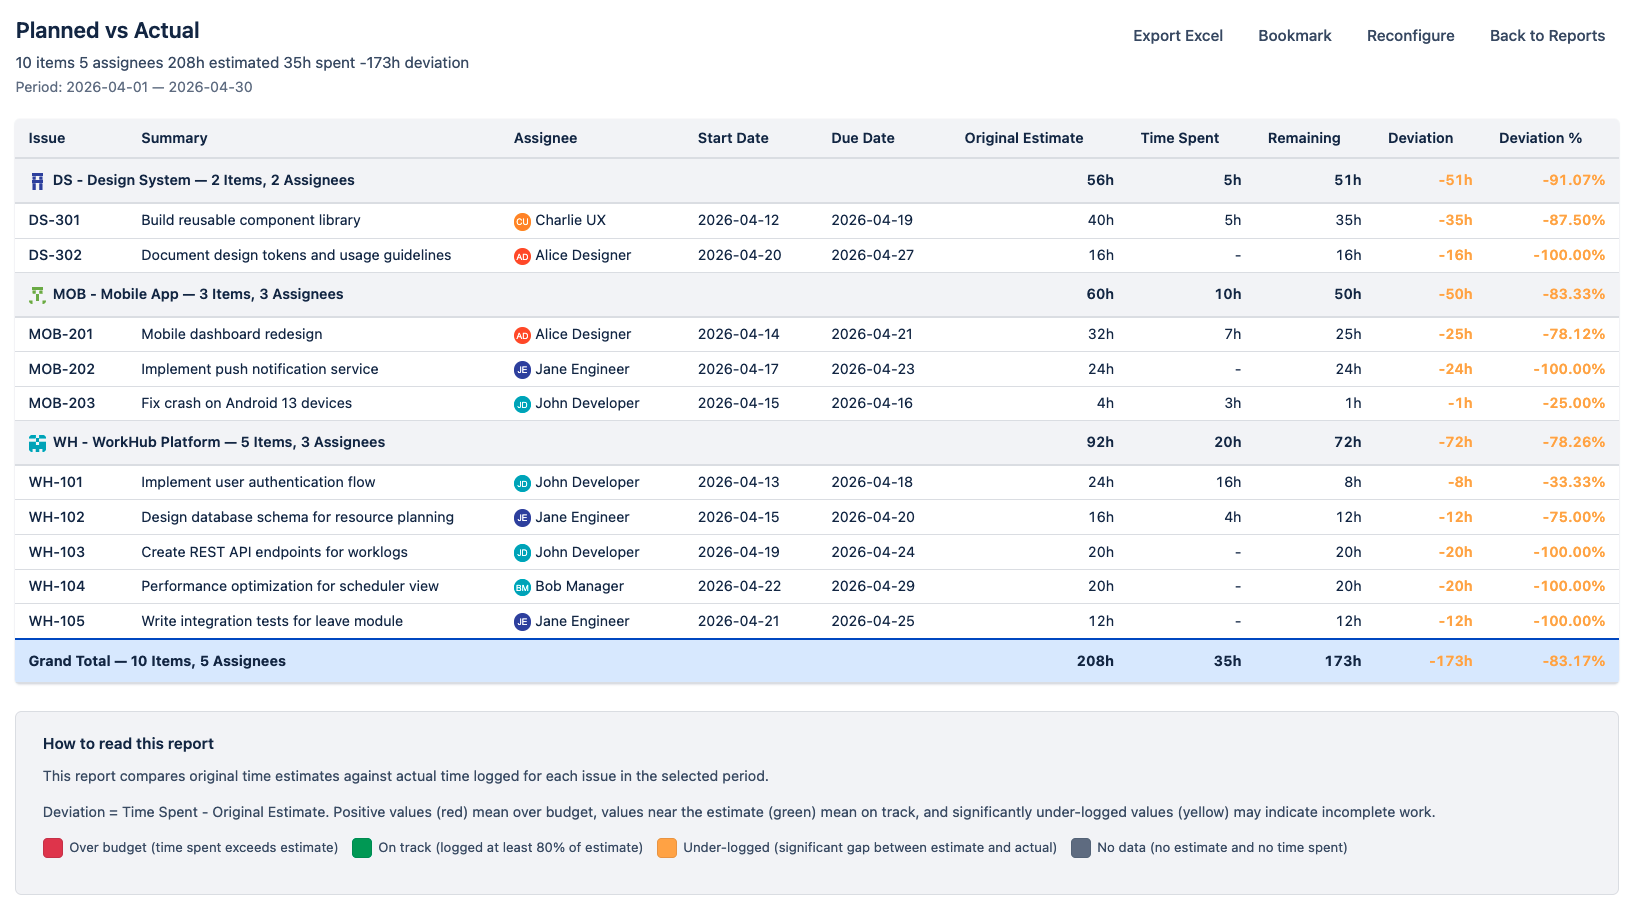
The Planned vs Actual report tracks each issue’s Original Estimate against the Time Spent and Remaining Estimate stored on the issue in Jira. It computes a deviation and a status verdict (on track, under-estimated, or over-estimated) per issue and per project, so you can see where the original plan still holds and where reality has diverged.
Two Views
- By Issue — each row is an individual Jira issue, grouped by project with a per-project summary row that sums the project’s issues.
- By Project — project rollup rows only, hiding the per-issue breakdown for a high-level overview.
Columns
| Column | What it shows |
|---|---|
| Issue Key | The Jira issue key (e.g., WH-123). Click to open the issue in Jira. |
| Issue Summary | The issue title. |
| Assignee | The person assigned to the issue. |
| Start / End | Timeline dates from the mapped Jira date fields. |
| Original Estimate | Jira’s timeoriginalestimate — the time originally planned when the issue was estimated. |
| Time Spent | Jira’s timespent — cumulative hours logged on the issue across its entire lifetime, not just within the report period. |
| Remaining Estimate | Jira’s timeestimate — the remaining work as currently estimated. Jira auto-decrements this when work is logged, but it can also be edited directly to reflect a revised estimate. |
| Deviation | (Time Spent + Remaining) − Original Estimate. Positive means the current commitment now exceeds the original plan; negative means the plan was larger than what was actually needed. |
| Deviation % | ((Time Spent + Remaining) / Original Estimate) × 100 − 100. |
| Status | A three-state badge derived from the deviation — see below. |
Status
The Status badge measures whether the original plan still holds, not whether work has been completed. It is set per issue and recomputed for each project rollup from the summed totals.
- ON TRACK —
Time Spent + Remainingequals the Original Estimate (within a 2-minute tolerance). The plan still matches the current commitment, even if work is only partly done. - UNDERESTIMATED —
Time Spent + Remainingexceeds the Original Estimate. The team now expects to need more time than originally planned. Also applies when work was logged on an issue with no original estimate. - OVERESTIMATED —
Time Spent + Remainingis below the Original Estimate. The plan was larger than what is actually needed.
Project Rollup
Project subtotals and the grand total are computed by summing each issue’s Original Estimate, Time Spent, and Remaining Estimate, then applying the same Deviation and Status formulas to those sums. Issues with offsetting deviations can net out at the project level.
Use Cases
- Sprint retrospectives — identify which issues drifted from their original estimate and why.
- Estimate calibration — spot teams or individuals who consistently under- or over-estimate; the status badges aggregate cleanly at the project level.
- Forecast vs commitment tracking — see at a glance whether the current commitment (Spent + Remaining) is creeping past the originally agreed plan.
ON TRACK because the original plan has not yet been contradicted — even though no work has happened. To see "% complete" or schedule progress, use the Resource Utilization or Project Resources reports.
Split Issues in Reports Back to top
Split issues count once in every metric that counts issues, while each part-owner counts as an assignee. Hours are always taken from the parts — each person's utilization and project totals include only their own share. Planned vs Actual collapses a split issue to a single row whose planned and remaining hours are the totals across all its parts — a split issue is judged as a whole whenever any of its parts falls in the report period.
Creating Reports Back to top
To generate a report, click a template card from the gallery. A configuration dialog opens with options specific to that report type. Fill in the parameters and click Generate.
Each report type has a different set of configuration options:
| Report | Period | Scope | Grouping | Filters |
|---|---|---|---|---|
| Utilization Forecast | This Week, Next Week, This Month, Next Month, Custom | Day, Week, Month | None, Team, Project, Item | Teams, People, Projects |
| Project Resources | This Week, Next Week, This Month, Next Month, Custom | Day, Week, Month | Project (fixed) | Projects |
| Leave Report | This Month, Last Month, This Quarter, Last Quarter, This Year, Custom | Day, Week, Month | None, Team | Teams, People |
| Worklog Report | Today, This Week, Last Week, This Month, Last Month, Custom | — | None, Team | Teams, People |
| Planned vs Actual | Today, This Week, Last Week, This Month, Last Month, Custom | — | Project (fixed) | Projects |
| Advanced Utilization | Current Week, Next 2/4 Weeks, Current Month, Current/Next 4 Weeks, Current Quarter, Custom | Day, Week, Month | Multi-level (any native or custom Jira field; up to 6 levels) | Jira saved filter, Teams, People, Projects |
Bookmarking Reports Back to top
Save frequently used report configurations as bookmarks so you can re-run them without re-entering parameters each time. Bookmarks remember the report type, date range, scope, grouping, and all filter settings.
- Generate a report using the steps above.
- Click "Save as Bookmark" in the report toolbar.
- Enter a name for the bookmark (e.g., "Weekly Team Utilization" or "Q2 Leave Summary").
- Click "Save" — the bookmark appears in the Bookmarked Reports tab on the Reports view.
To re-run a bookmarked report, switch to the Bookmarked Reports tab and click the bookmark card. The report generates immediately using the saved configuration. After adjusting an open bookmark (via Reconfigure or in-view filters), clicking Bookmark lets you either Update the existing bookmark in place or Save as New. You can also delete bookmarks you no longer need.
Tip
Create bookmarks for recurring reports such as weekly utilization checks or monthly leave summaries. This saves time and ensures consistency when reviewing the same metrics across periods.
Exporting to Excel Back to top
Any generated report can be exported to an Excel spreadsheet for offline analysis, sharing with stakeholders, or archiving.
- Generate a report using any of the five report templates.
- Click "Export to Excel" in the report toolbar.
- An .xlsx file is downloaded to your computer containing the same data shown in the report view — all columns, rows, groupings, and totals are preserved.
Tip
Use the exported Excel file to build custom charts, share utilization summaries with management, or compare planned vs. actual hours in your own spreadsheet workflows.
Need Help?
If you have questions or need assistance, our support team is here to help.
Contact Support