Overview Back to top
Reports gives you five ready-made reports. Each one answers one question about your team's workload, time off or logged time. You choose the period and the people, the report is built, and you can save the set-up as a bookmark or export the result to Excel.
Open the app from the monday.com sidebar and click Reports. There are two tabs:
- Report Templates — the five reports. Click a card to set up and run one.
- Bookmarked Reports — the set-ups you saved. Click one to run it again.

Reports read your monday.com boards. Make sure each board is set up in Settings > Boards, with the people, dates and hours columns mapped. Otherwise the numbers will be empty or wrong.
Creating a Report Back to top
- On the Report Templates tab, click the card of the report you want.
- Fill in the dialog. The fields depend on the report (see the table below).
- Click Create. The report opens as a table.

| Field | What it does | Reports that have it |
|---|---|---|
| Period | The dates the report covers. Pick a ready-made period or Custom Range with a start and end date. | All |
| Scope | What one date column stands for: Day, Week or Month. | Utilization Forecast, Board Resources Forecast, Leave Report |
| Teams and People | Limit the report to some monday.com teams or people. | All except Board Resources Forecast |
| Boards | Limit the report to some boards. Leave it empty to include all boards set up in the app (the 100 newest at most). Planned vs Actual needs at least one board. | Utilization Forecast, Board Resources Forecast, Planned vs Actual |
| View | By Item or By Board. | Planned vs Actual |
| Group by | How rows are grouped. | Utilization Forecast, Detailed Worklog Report |
Above every finished report you find four buttons:
- Export Excel — download the report. See Exporting to Excel.
- Bookmark — save the set-up. See Bookmarking reports.
- Reconfigure — open the dialog again, change something and run the report again.
- Back to Reports — return to the gallery.
The Five Reports Back to top
The card in the gallery and the report it opens have different names:
| Gallery card | Report title | Question it answers |
|---|---|---|
| Capacity & Utilization Overview | Resource Utilization Forecast | How busy is each person compared with the hours they can work? |
| Project Allocation Breakdown | Board Resources Forecast | How is the work on each board shared between people? |
| Time-Off & Absence Summary | Leave Report | Who is away, and when? |
| Work Log Audit Trail | Detailed Worklog Report | What time was logged, by whom, on what? |
| Planned vs Actual | Planned vs Actual | How do logged hours compare with the estimate? |
Resource Utilization Forecast Back to top
Open it with the Capacity & Utilization Overview card. Use it to see who is overbooked and who has room in the coming weeks.
Utilization is the share of a person's available hours that is taken by planned work. 40 hours of work in a 40-hour week is 100%.
| Column | What it shows |
|---|---|
| Total Available Capacity (Hours) | The hours the person can work. It comes from their capacity scheme, minus public holidays and approved leave. |
| Utilized Capacity (Hours) | The hours of work planned for the person. |
| Utilization Rate (%) | Utilized Capacity divided by Total Available Capacity. |
| Date columns | The planned hours for each day, week or month. See the colours below. |

| Cell colour | Meaning |
|---|---|
| Gray | Non-working day: weekend, holiday or leave. |
| Blue | Underloaded: 1–50% of the available hours are planned. |
| Green | Balanced: 51–100%. |
| Orange | Warning: 101–120%. |
| Red | Overloaded: more than 120%. |
Which hours count as "planned"
That depends on the workload basis an admin chose in Settings > Workload. The report prints the basis under its title.
| Workload basis | What the report counts |
|---|---|
| Live workload (the default) | The work that is still left: each item's estimate minus all time already logged on it, spread from today to the item's end date. Days in the past are not counted. |
| Planned workload | Each item's estimate spread across the item's full dates, past days included. An admin chooses whether this is the original estimate or the remaining estimate. |
| Time Tracking off | Each item's estimate spread across its full dates. |
Group by
- None — one row per person.
- Team — people grouped by monday.com team, with a total per team.
- Board — open a person to see their hours per board.
- Item — open a person to see their hours per item.
Allocations. Allocations (time booked without an item, such as training) count as planned hours in this report. If you limit the report to some boards, only allocations booked on those boards are included.
Board Resources Forecast Back to top
Open it with the Project Allocation Breakdown card. Use it to see how many planned hours each board (project) needs, and from whom.
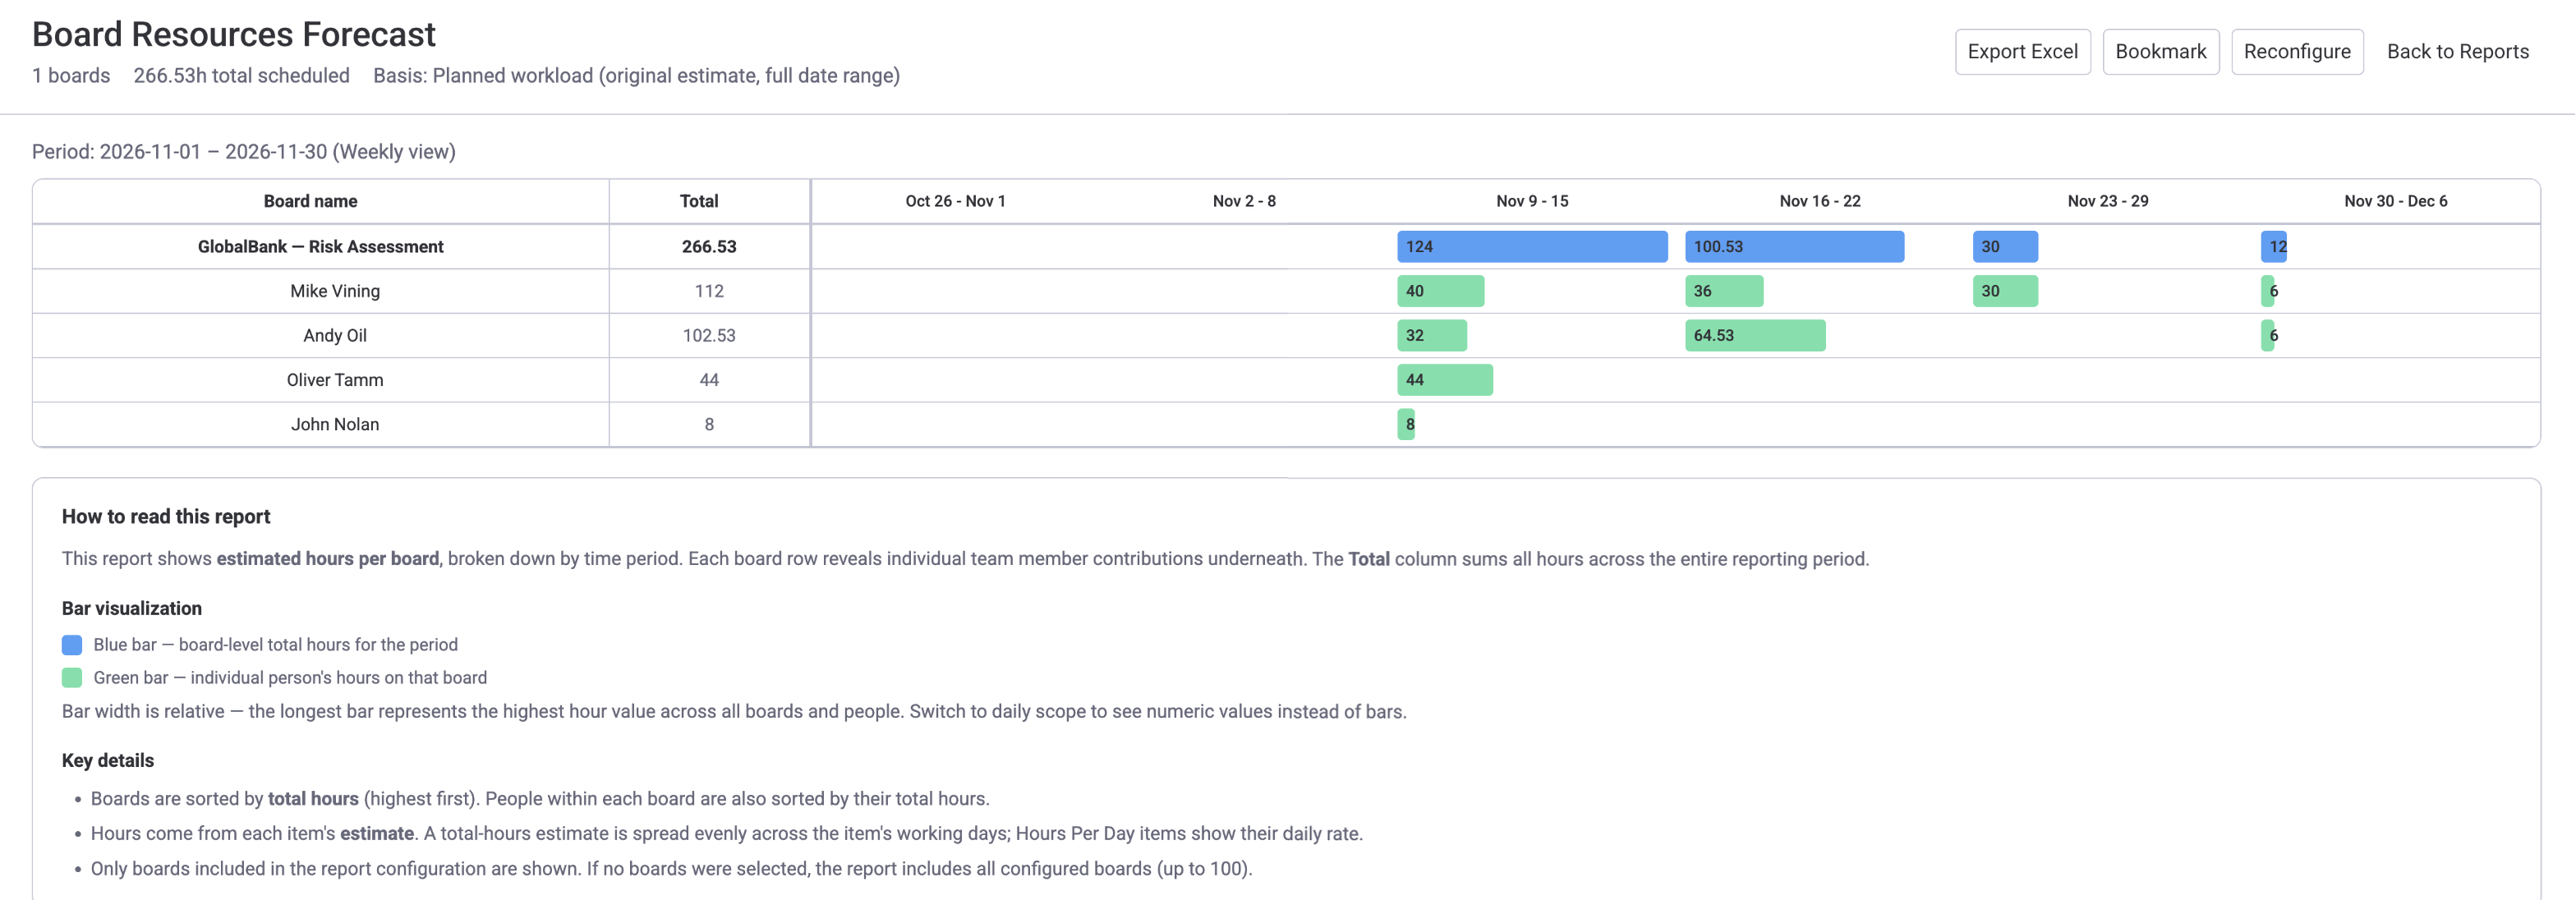
The blue bar is the board total for the week; the green bars are each person’s hours.
| Column | What it shows |
|---|---|
| Board name | One row per board. Open a board to see one row per person. |
| Total | The planned hours for the whole period. |
| Date columns | The planned hours per day, week or month. |
- "Planned hours" follow the same workload basis as the Utilization Forecast (see above).
- An allocation booked on a board is added to that board. Allocations booked on a category belong to no board and are not listed.
- This report shows planned work, not logged time. For logged time use the Detailed Worklog Report.
Leave Report Back to top
Open it with the Time-Off & Absence Summary card. Use it to see how many days each person is away, by leave type, and when.

Each coloured label is a leave type and its number of days; H is a public holiday.
| Column | What it shows |
|---|---|
| Team / Person | The person, under their team. |
| Total, days | All leave days in the period. A full day counts as 1 and a half day as 0.5. Partial-hours leave counts as its hours divided by that day's working hours. |
| H, days | Public holidays in the period, from the person's holiday calendar. |
| One column per leave type | Days per leave type. Each type is shown as a short code; the legend under the table explains the codes. |
| Date columns | The leave in each day, week or month, as a coloured label with the code and the number of days. |
Detailed Worklog Report Back to top
Open it with the Work Log Audit Trail card. It lists every worklog (one entry of logged time) in the period, one per row. Use it for invoices, payroll and audits.
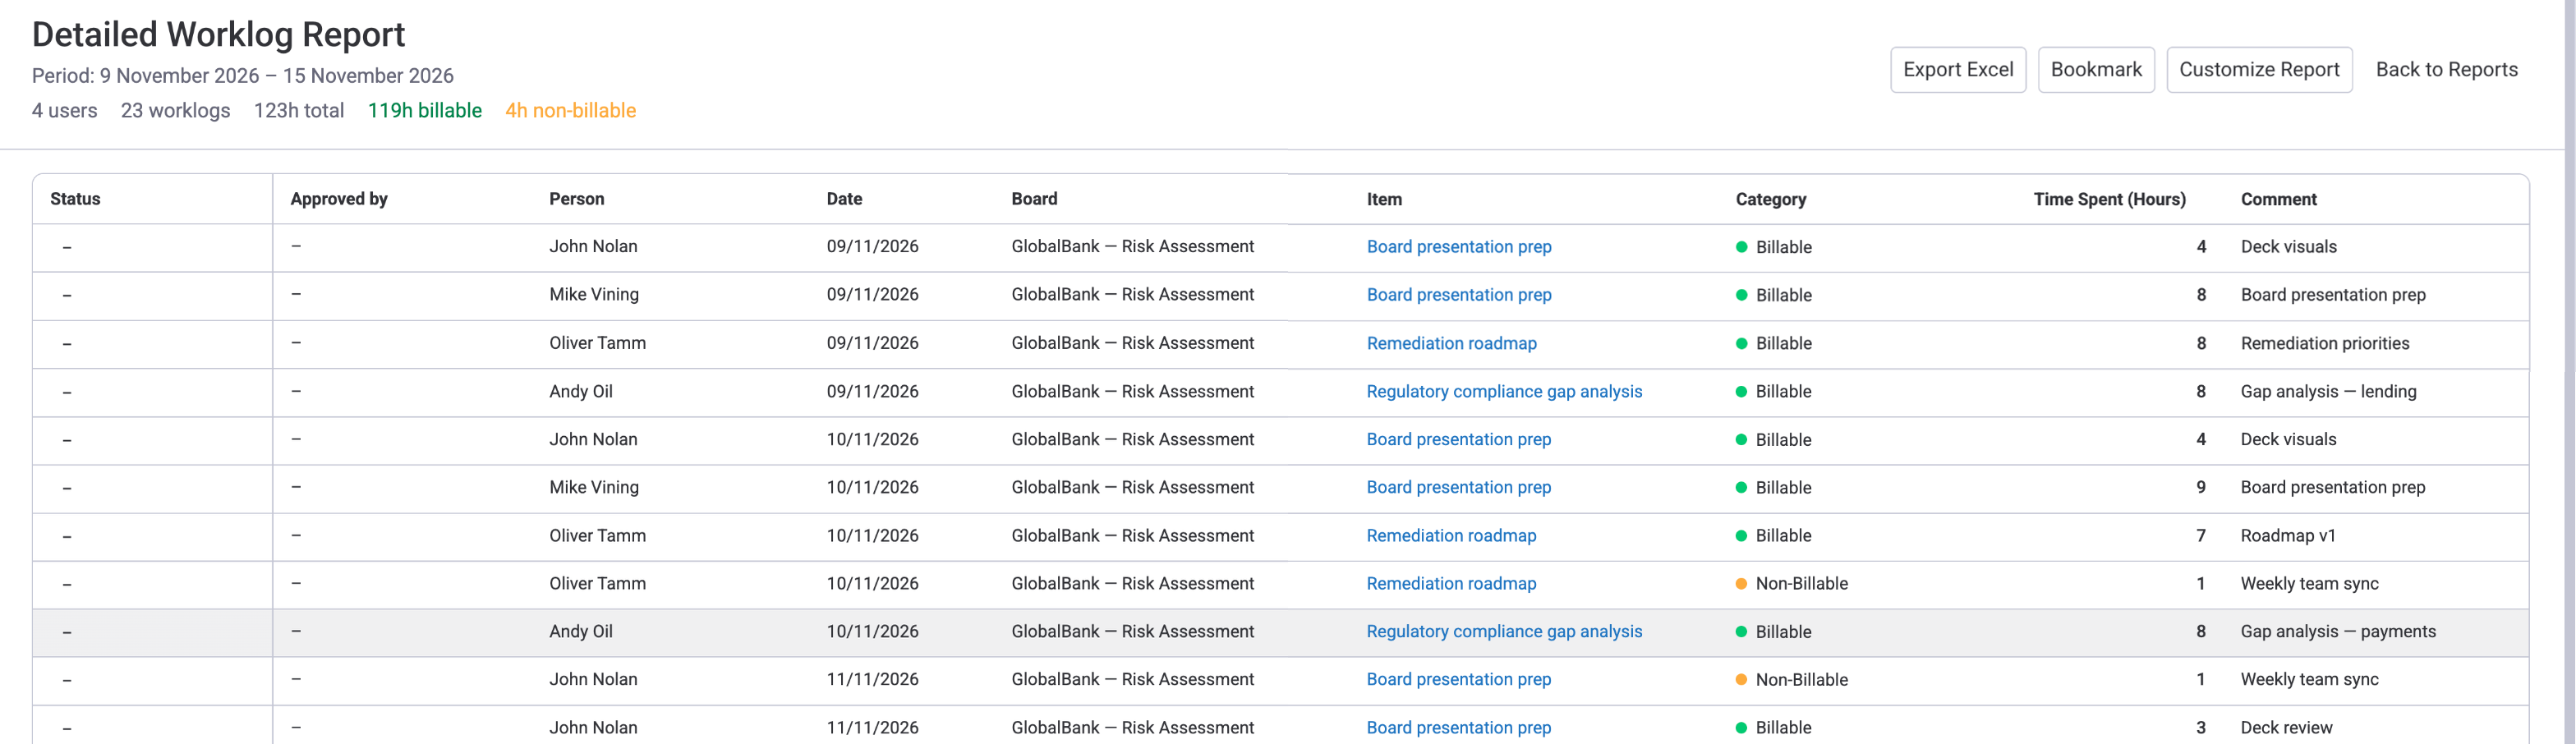
The line under the title sums the worklogs and splits the hours into billable and non-billable.
| Column | What it shows |
|---|---|
| Status | Where the worklog's timesheet stands. Shown only while the timesheet approval workflow is on. |
| Approved by | Who reviewed the timesheet. A dash means nobody has yet. Shown only while the approval workflow is on. |
| Person | Whose time it is. |
| Date | The day the work was done. |
| Board and Item | What the time was logged on. |
| Category | The worklog category, for example Billable or Non-Billable. |
| Time Spent | The hours logged. |
| Comment | The work description. |
Status values
| Status | Meaning |
|---|---|
| Submitted | The timesheet was sent and waits for the approver. |
| Closed Approved | The timesheet was approved. |
| Closed Rejected | The timesheet was rejected. |
| Reopened | An approved timesheet was opened again for corrections. |
Set-up options
- Period, Teams and People. There is no board filter.
- Group by — None, Board, Item or Category. To see one project's hours together, group by Board. The Excel file keeps the grouping.
Planned vs Actual Back to top
Use it to compare, item by item, the hours that were planned (the estimate) with the hours actually logged. It shows where work went over the estimate.
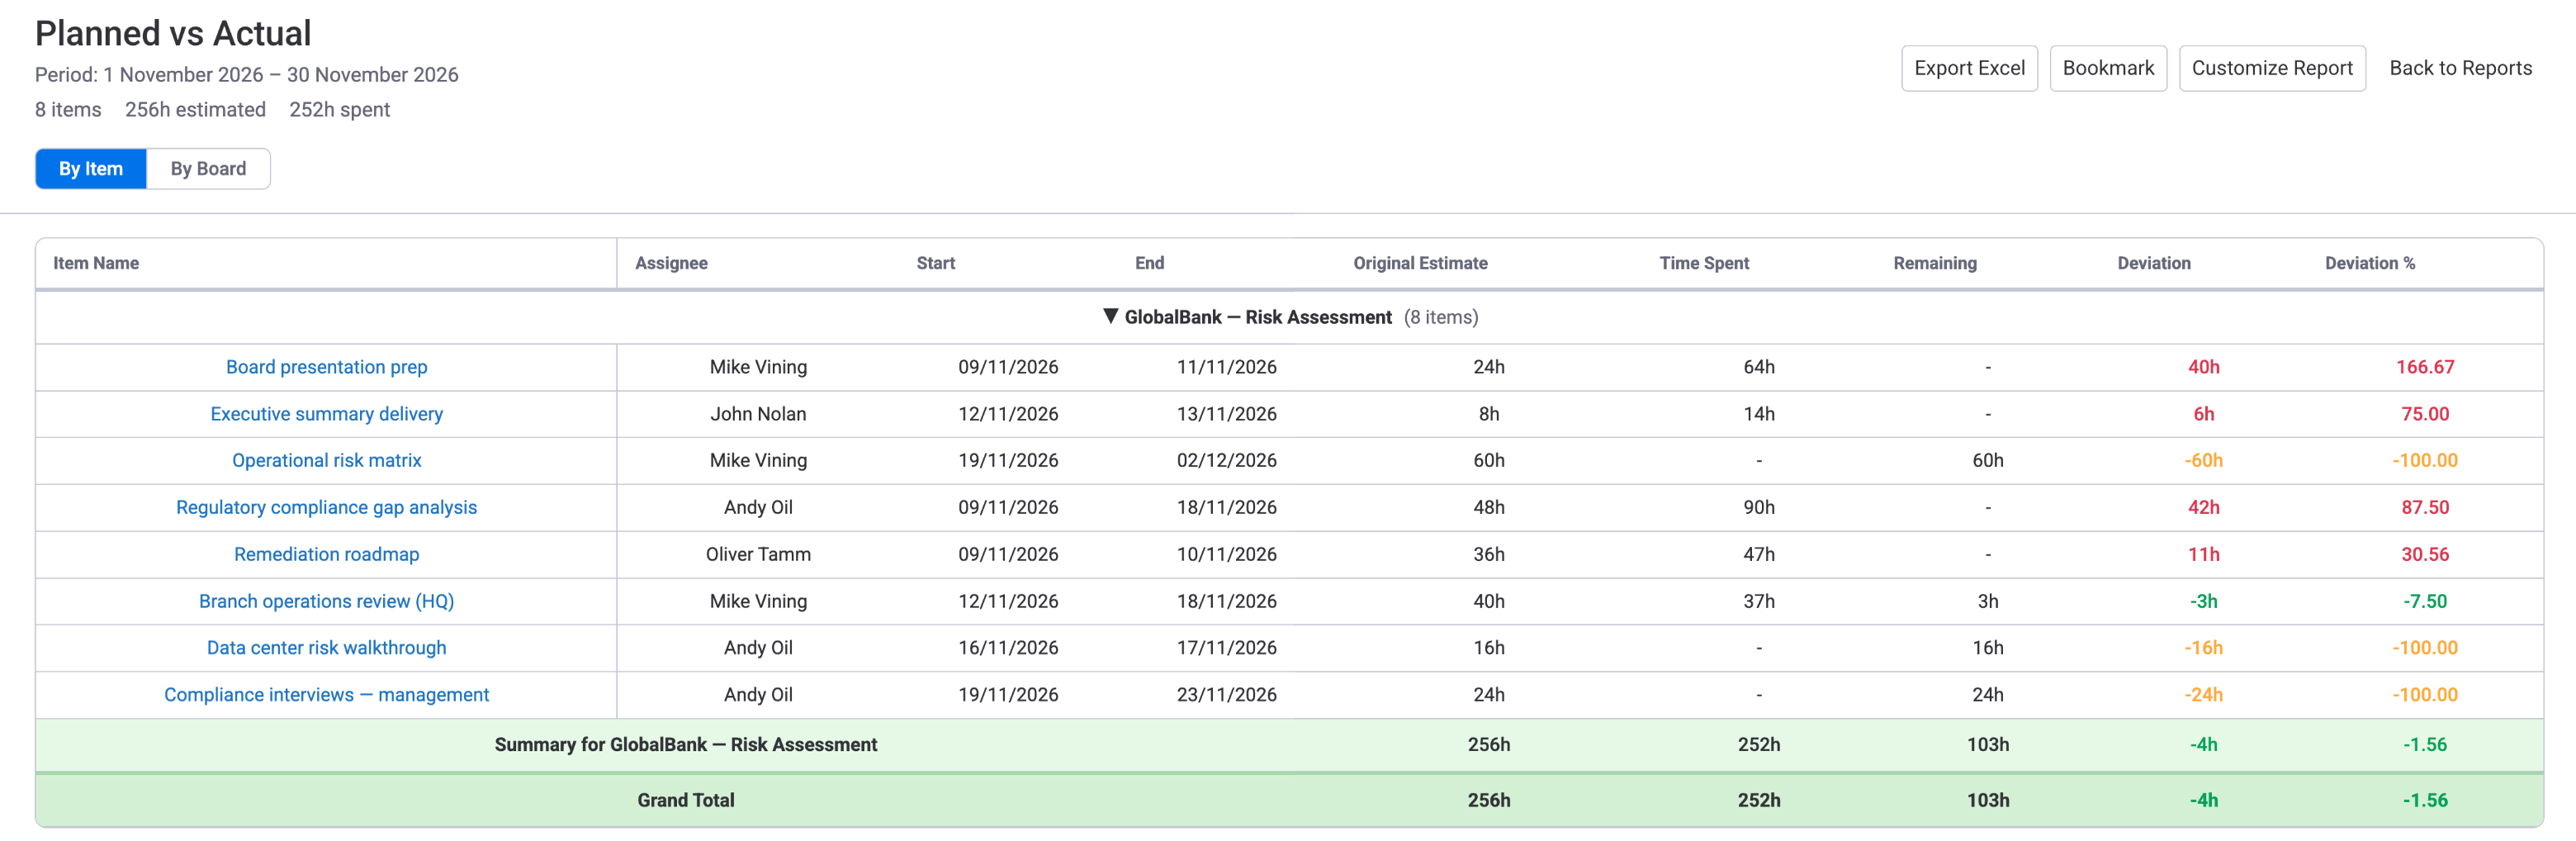
Red means more hours were logged than planned; orange means little or nothing is logged yet.
Two views
- By Item — one row per item or subitem, grouped by board, with a summary row per board.
- By Board — one row per board, with the number of items and assignees and the board's totals.
Columns (By Item)
| Column | What it shows |
|---|---|
| Item Name | The monday.com item. Click it to open the item. |
| Assignee | The people assigned to the item. |
| Start / End | The item's dates. |
| Original Estimate | The planned hours. If the board uses an hours-per-day column, it is hours per day times the working days in the item's dates. |
| Time Spent | All time ever logged on the item, by anyone. It is not limited to the report period. |
| Remaining | Original Estimate minus Time Spent. Never below 0. |
| Deviation | Time Spent minus Original Estimate. A positive number means over the estimate. |
| Deviation % | Deviation as a percentage of the Original Estimate. |
Deviation colours
| Colour | Meaning |
|---|---|
| Red | Over budget: more time was logged than estimated. |
| Green | On track: between 80% and 100% of the estimate is logged. |
| Orange | Under-logged: less than 80% of the estimate is logged. |
| Gray | No data: no estimate and no logged time. |
Working With a Report Table Back to top
- Sort — click a column header to sort. Click again to reverse, and a third time to go back to the normal order. In a grouped report, rows are sorted inside each group. Date columns cannot be sorted.
- Scroll — the header row and the first column stay in place while you scroll, so you always see which person and which date a number belongs to.
- Open an item — item names in the Detailed Worklog Report, Planned vs Actual (By Item) and the per-item rows of the Utilization Forecast are links. Click one to open the item in monday.com.
Sorting changes only what you see on screen. The Excel file and bookmarks keep the report's normal order.
Bookmarking Reports Back to top
A bookmark saves a report's set-up (period, people, boards, grouping) so you can run it again with one click.
- Run the report and click Bookmark above the table.
- Type a name (up to 200 characters) and save.
- Later, open the Bookmarked Reports tab and click the bookmark. The report is built again with current data. You can delete bookmarks you no longer need.
Bookmark the reports you run on a schedule, for example "Weekly team utilization" or "Monthly client worklogs".
Exporting to Excel Back to top
Click Export Excel above any report. An Excel (.xlsx) file is downloaded by your browser. Excel is the only export format.
- The file contains the report as set up: the same period, people, boards and grouping, including the rows inside groups.
- The file is named after the report and its period, for example
utilization_weekly_report_2026-01-01_2026-03-31.xlsx. - It opens in Excel, Google Sheets, Numbers and other spreadsheet apps.
Need Help?
If you have questions about reports or need help with your setup, our support team is here to help.
Contact Support