Overview Back to top
Open Reports from the main navigation. The Report Templates tab shows one card per report; the Bookmarked Reports tab holds the reports you have saved.
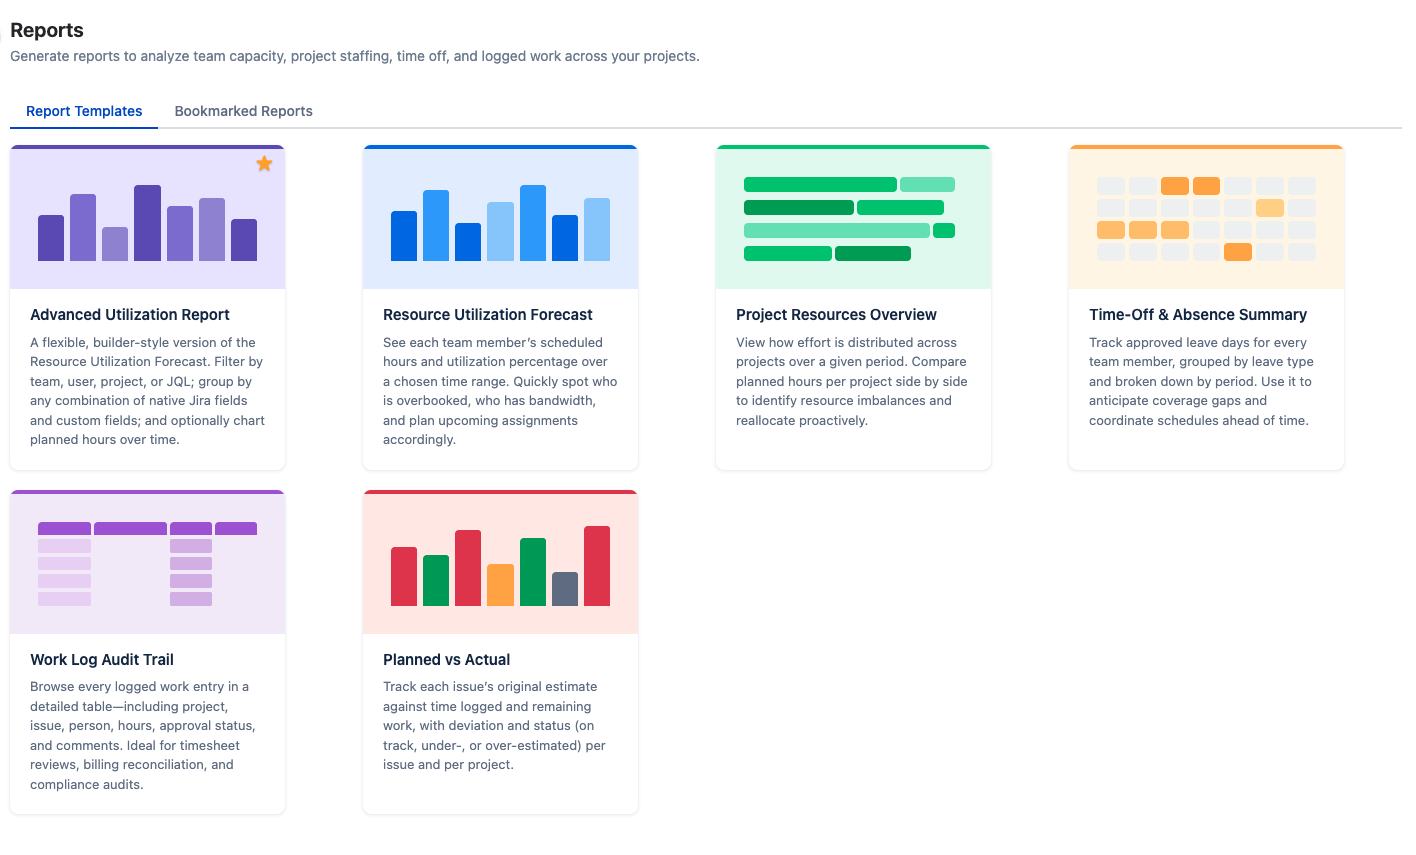
Click a card, choose the Period, Scope (Day, Week or Month columns), Group by and filters (Teams, People, Projects), then click Create. Pick Custom Range to enter exact dates. Use Reconfigure on the result to change the settings, and click any column header to sort.
Resource Utilization Forecast Back to top
Answers: who is overbooked and who has room for more work? For each person it compares available hours (after holidays and approved leave) with scheduled work and shows a utilization rate, with team subtotals.
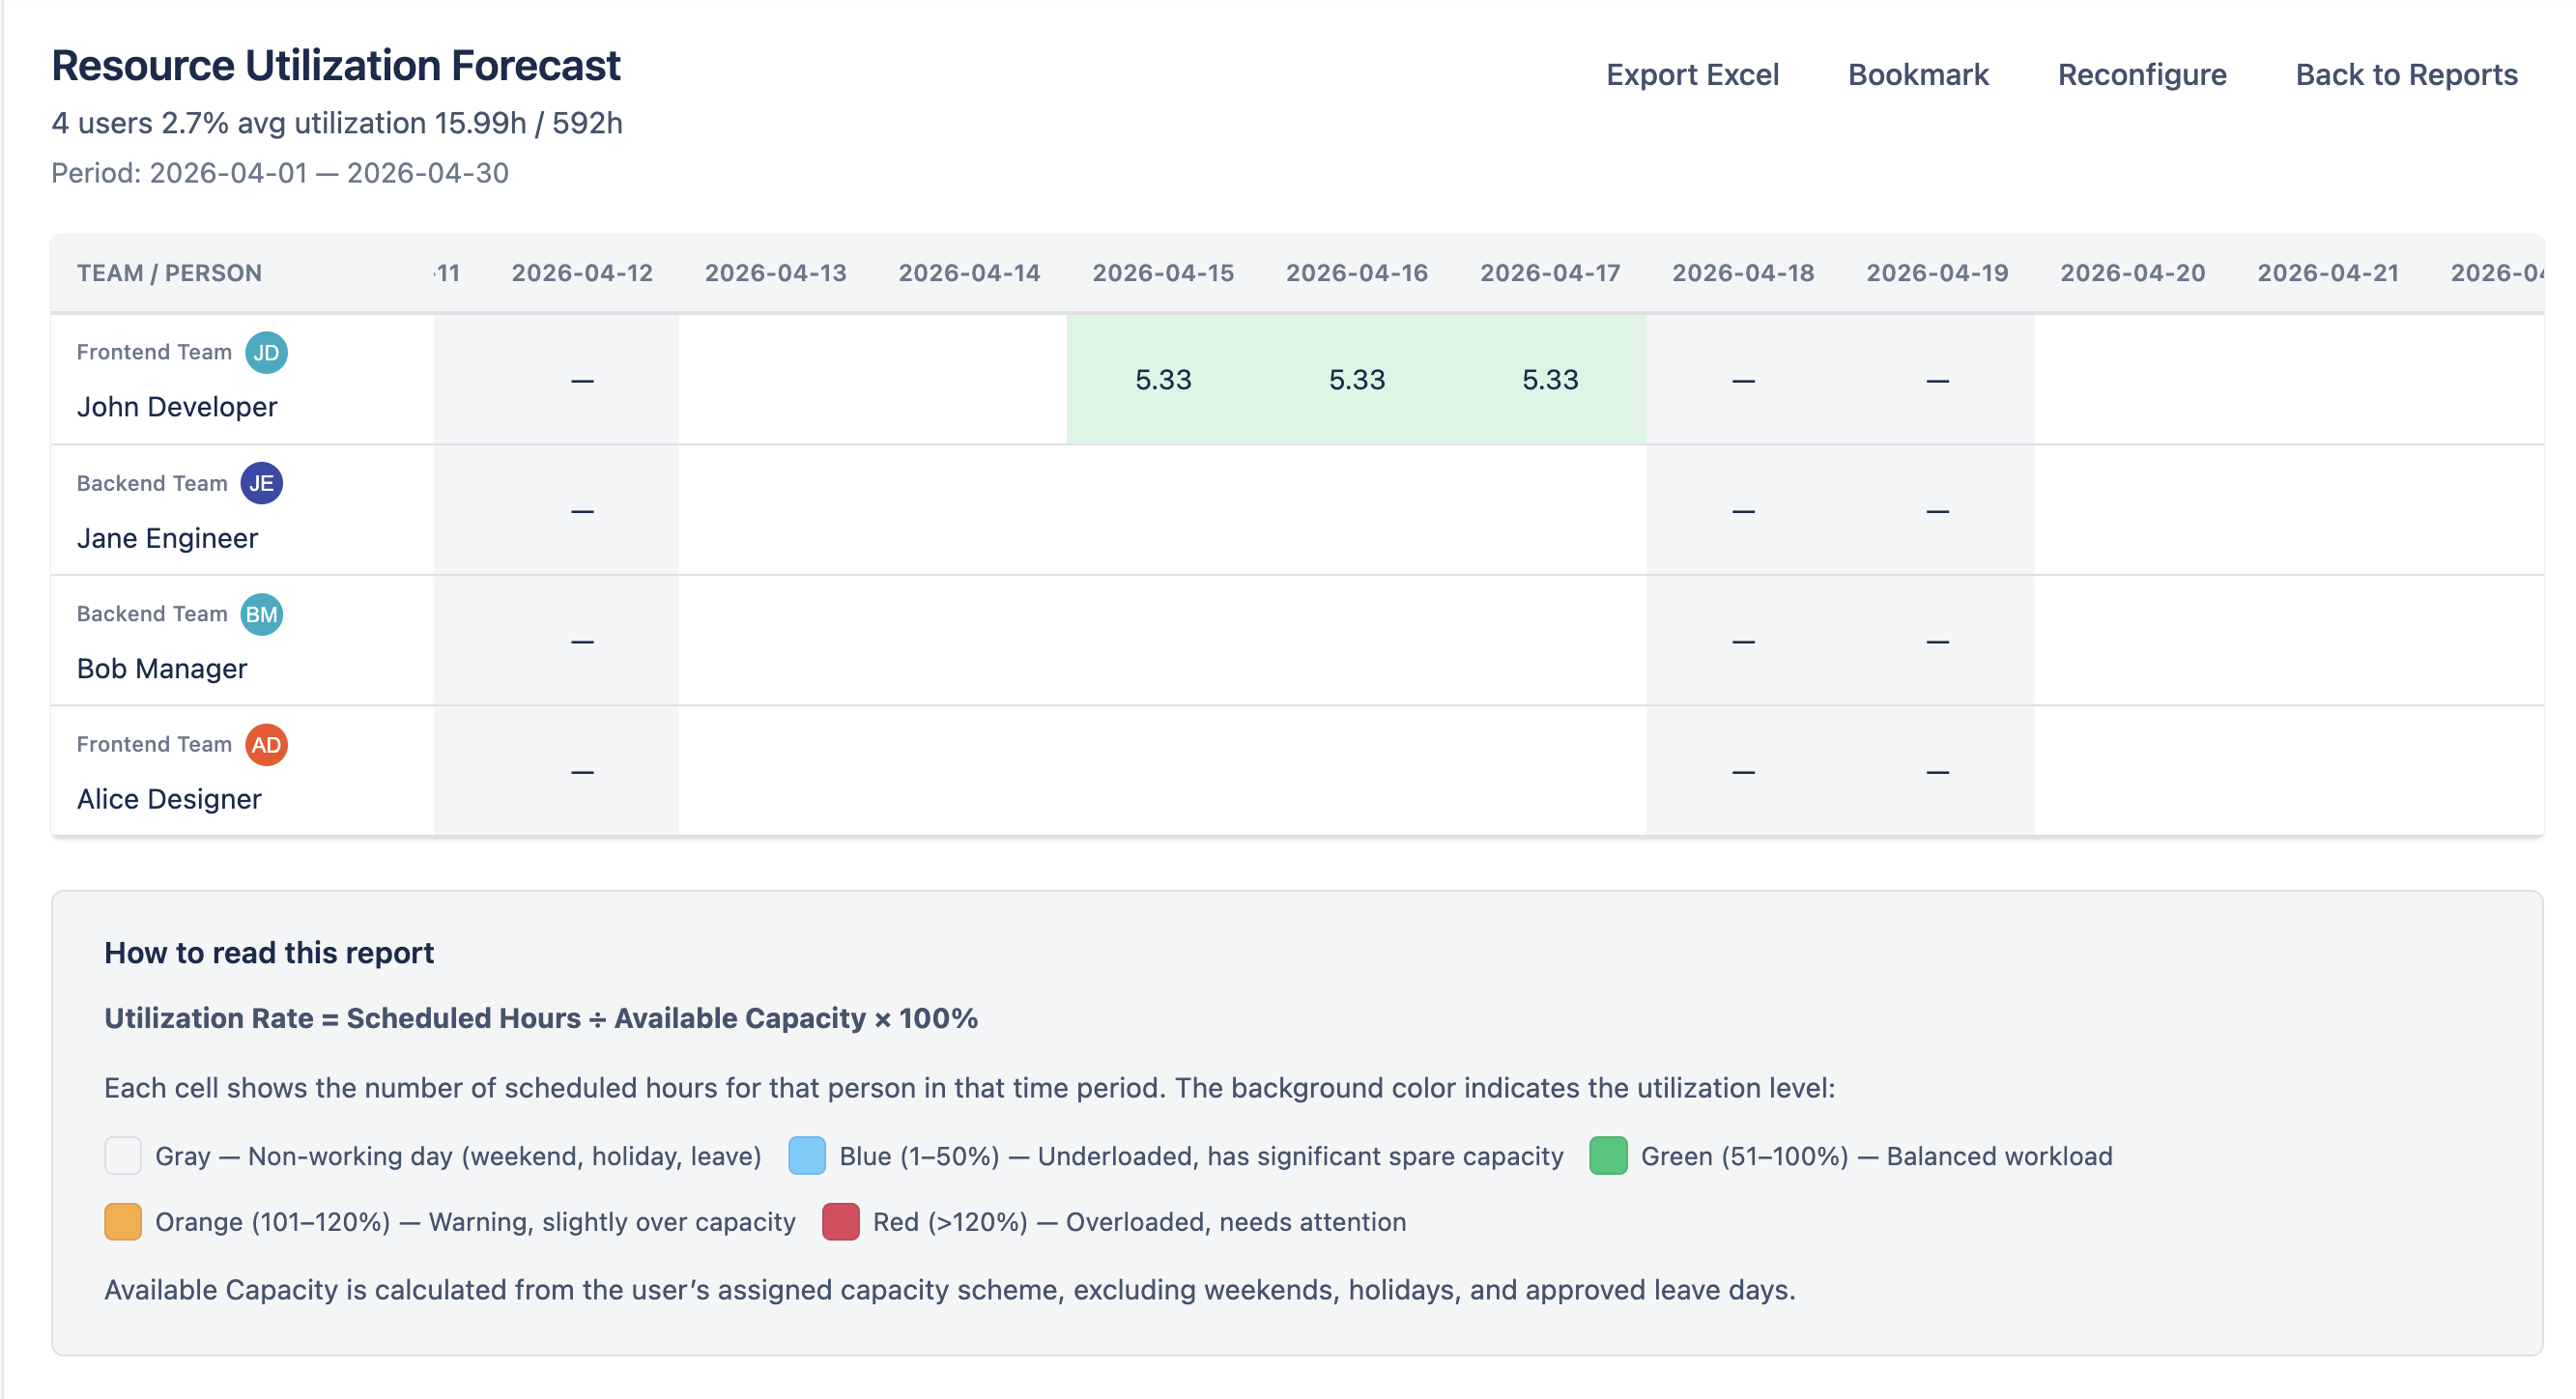
- Group by — None, or split each person's hours by Project, Epic or Issue.
- Display per-day cells as — Hours or Percentage of the day's capacity.
- Include allocations — on by default; turn off to count Jira issues only.
Cells use the same colors as the Scheduler workload: blue (under 50%), yellow-green, green (80–100%), orange and red (over 120%). Gray marks weekends, holidays and leave. Open How to read this report on the result for the full legend.
Advanced Utilization Report Back to top
Answers: where is planned work going, sliced any way you like? A flexible version of the Resource Utilization Forecast with the same numbers. Its card is marked with a star and opens straight into the report; all settings live in its header.
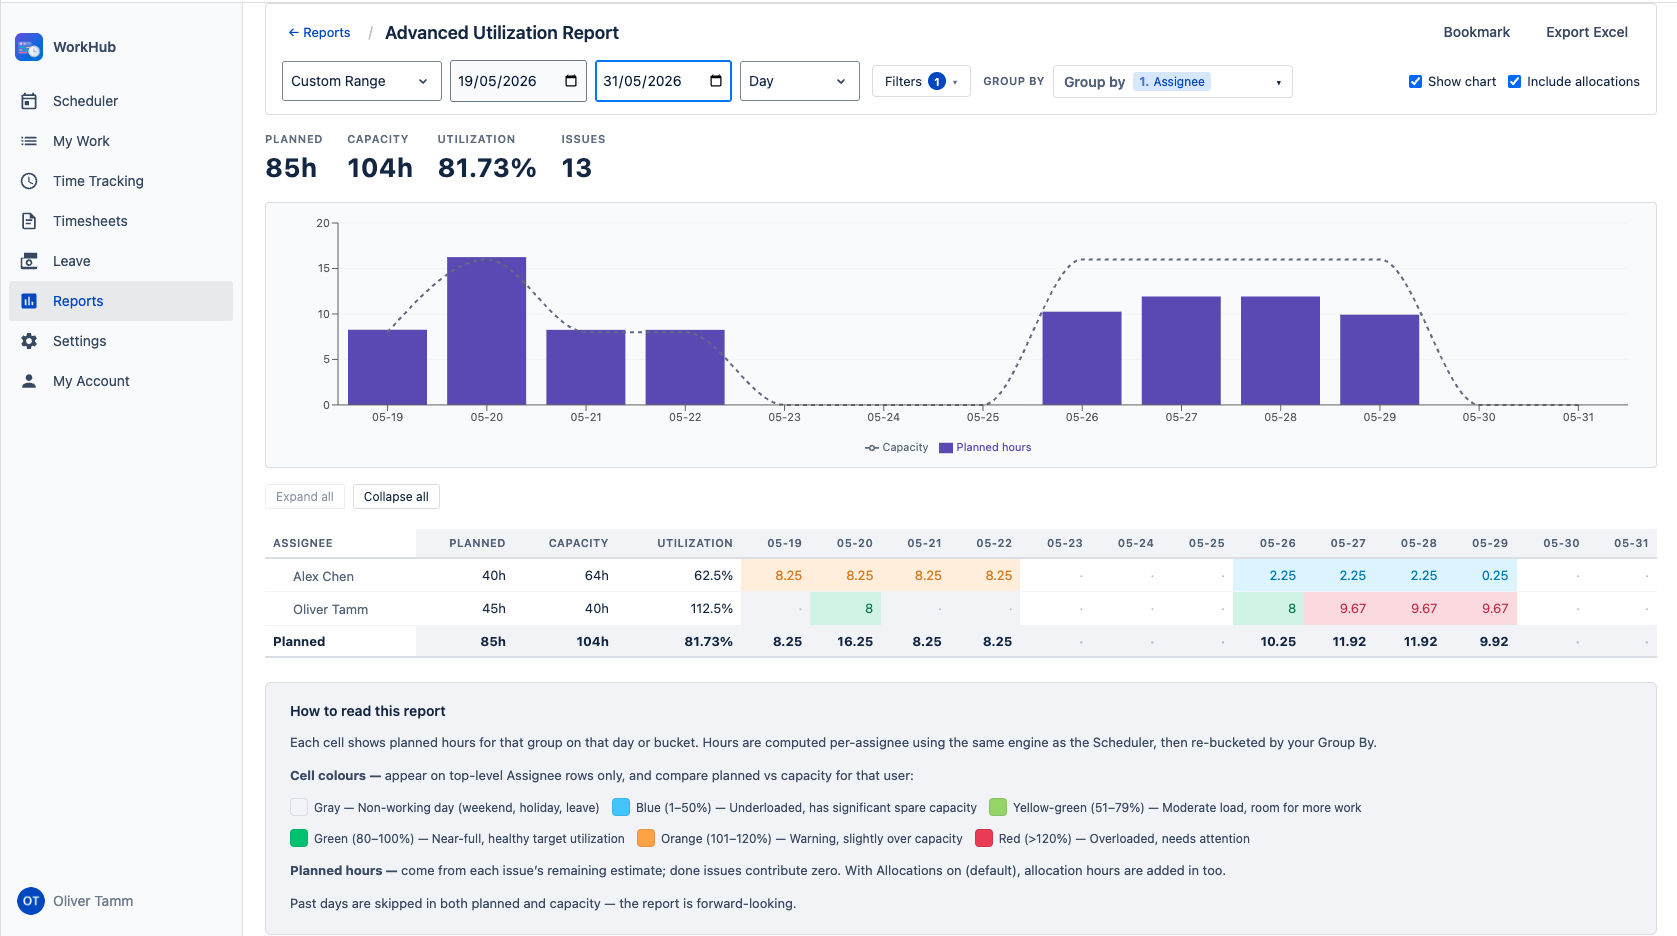
- Filters — a saved Jira filter, teams, people and projects. Click Apply to use your changes.
- Group by — up to six levels from Jira Fields and Custom Fields (for example Project → Assignee → Epic). Drag to reorder.
- Show chart and Include allocations — add a planned-hours chart and allocation hours.
When the first level is Assignee, the table also shows Capacity and Utilization per person, with colored cells and a capacity line on the chart.
Project Resources Overview Back to top
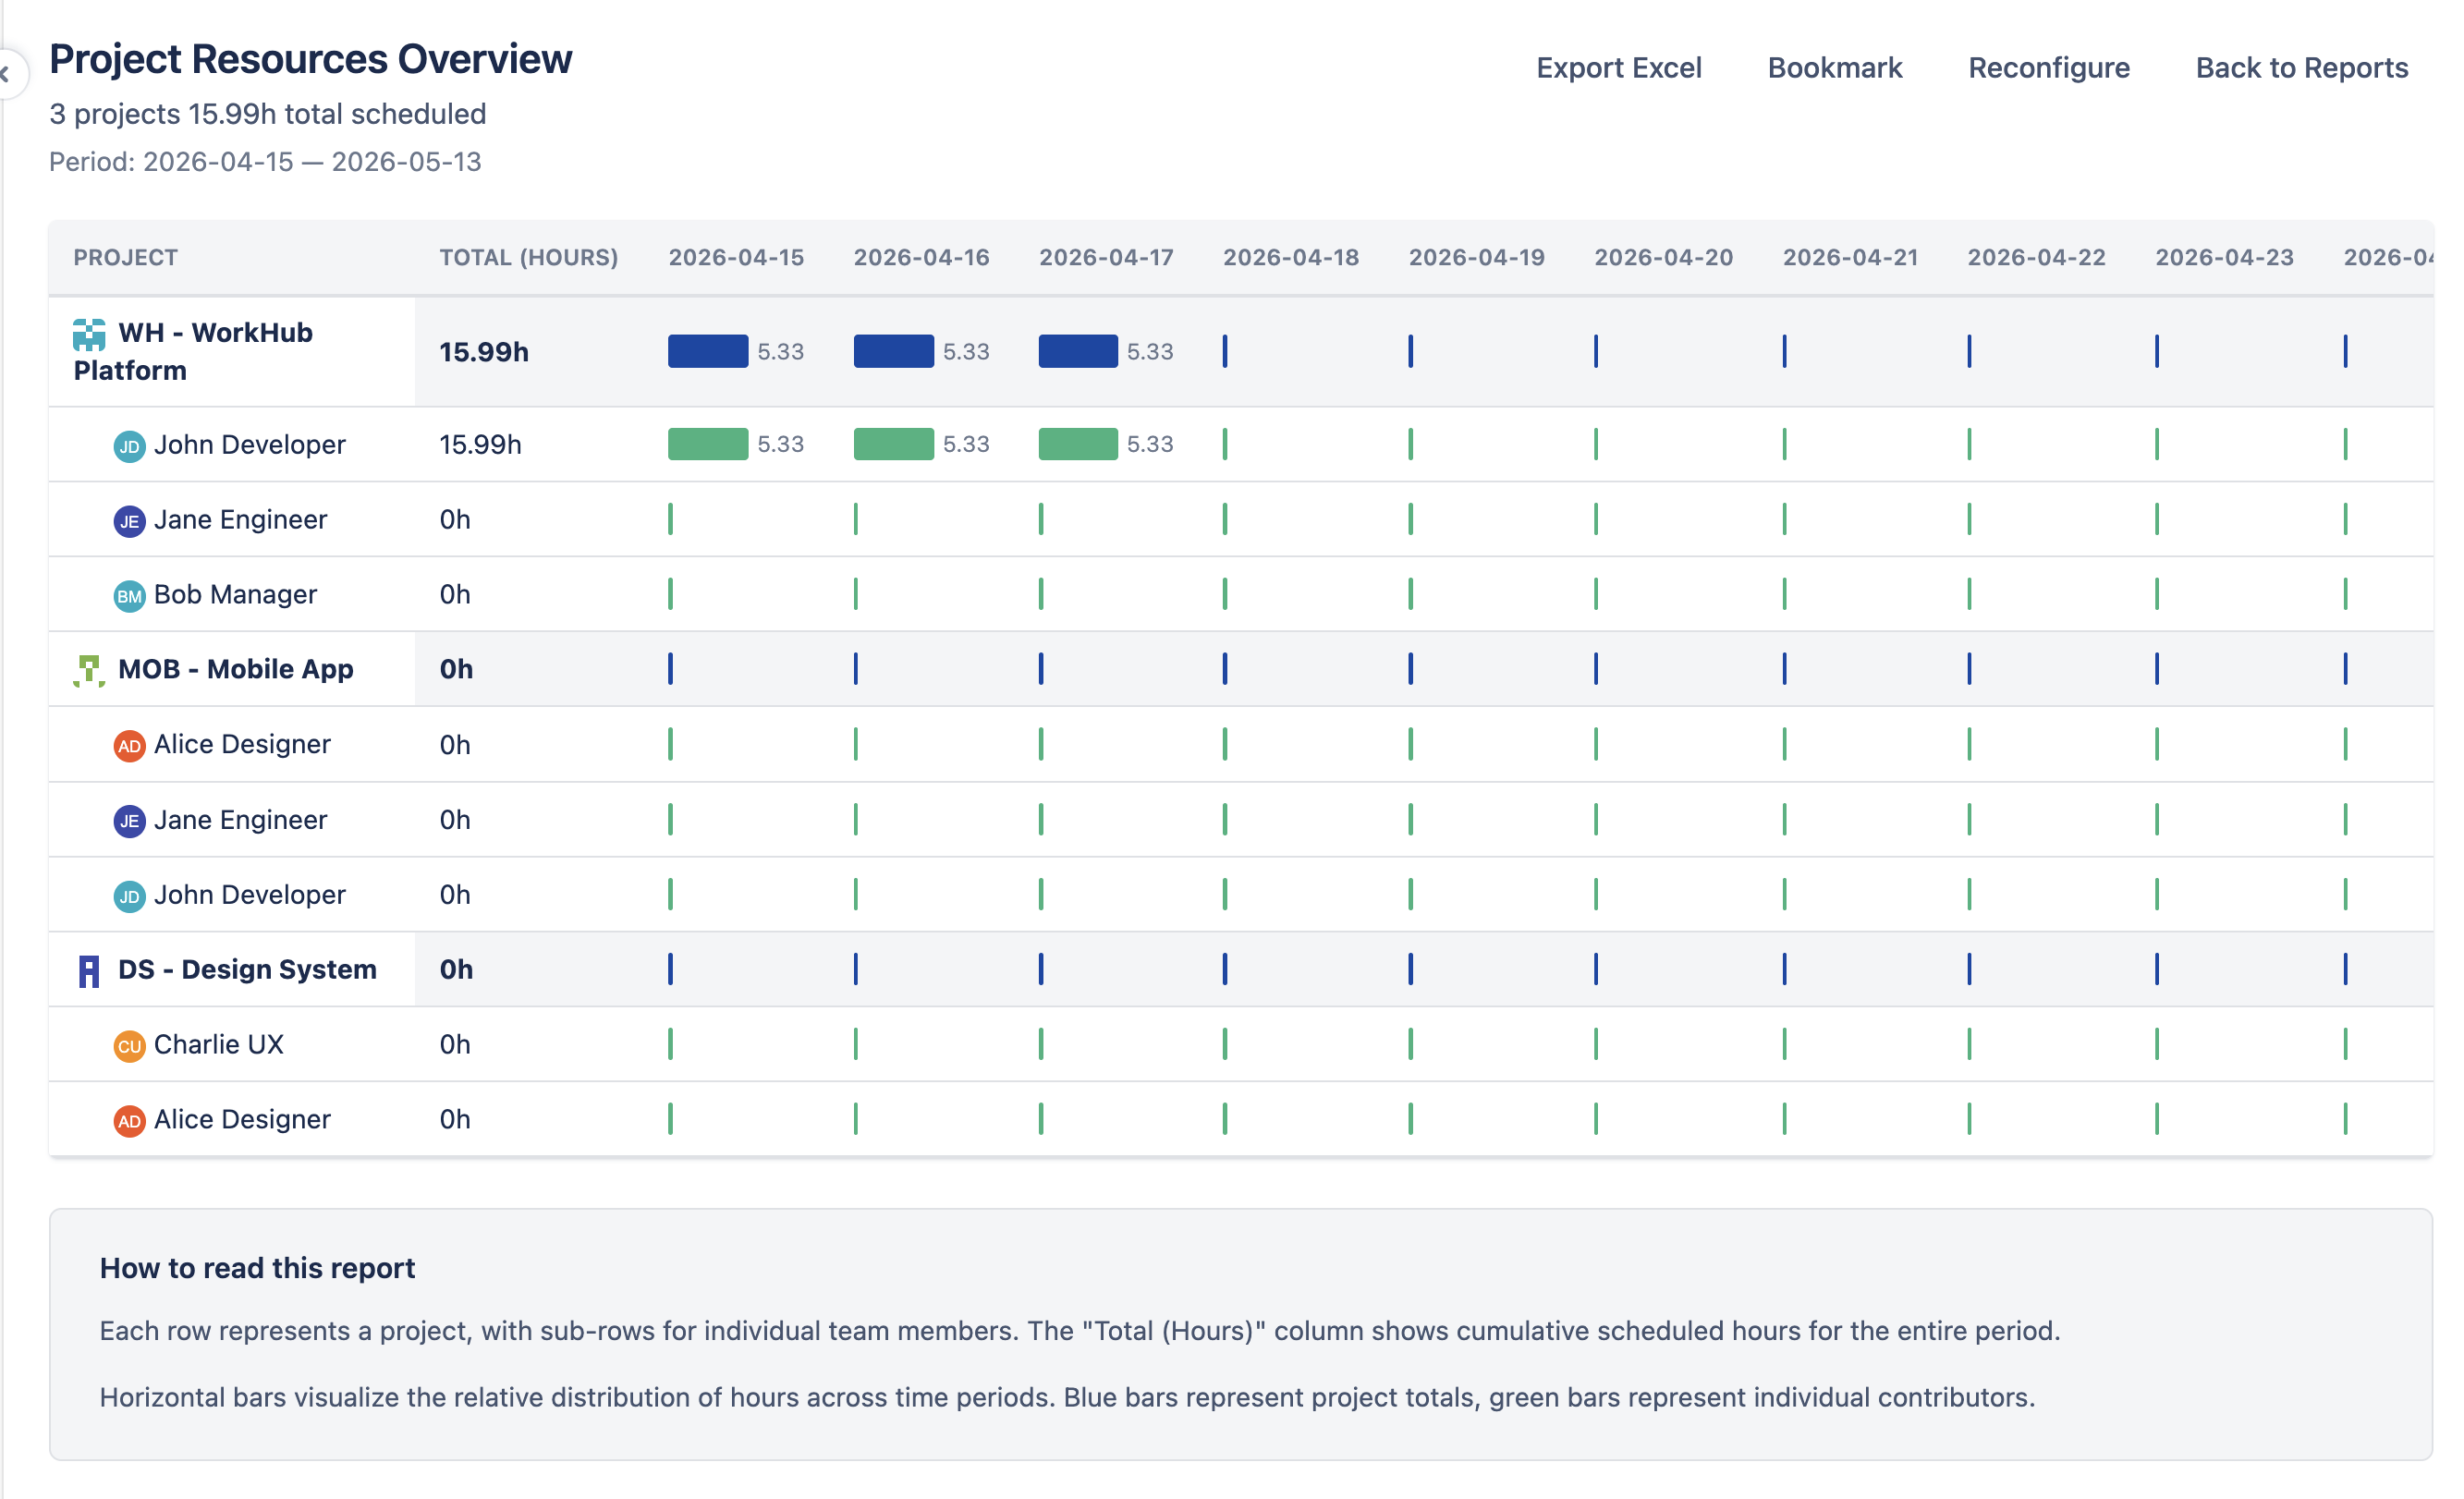
Answers: how is effort spread across projects? Each project is a row that expands into the people working on it, with planned hours per period. Turn off Include allocations to count Jira issues only.
Time-Off & Absence Summary Back to top
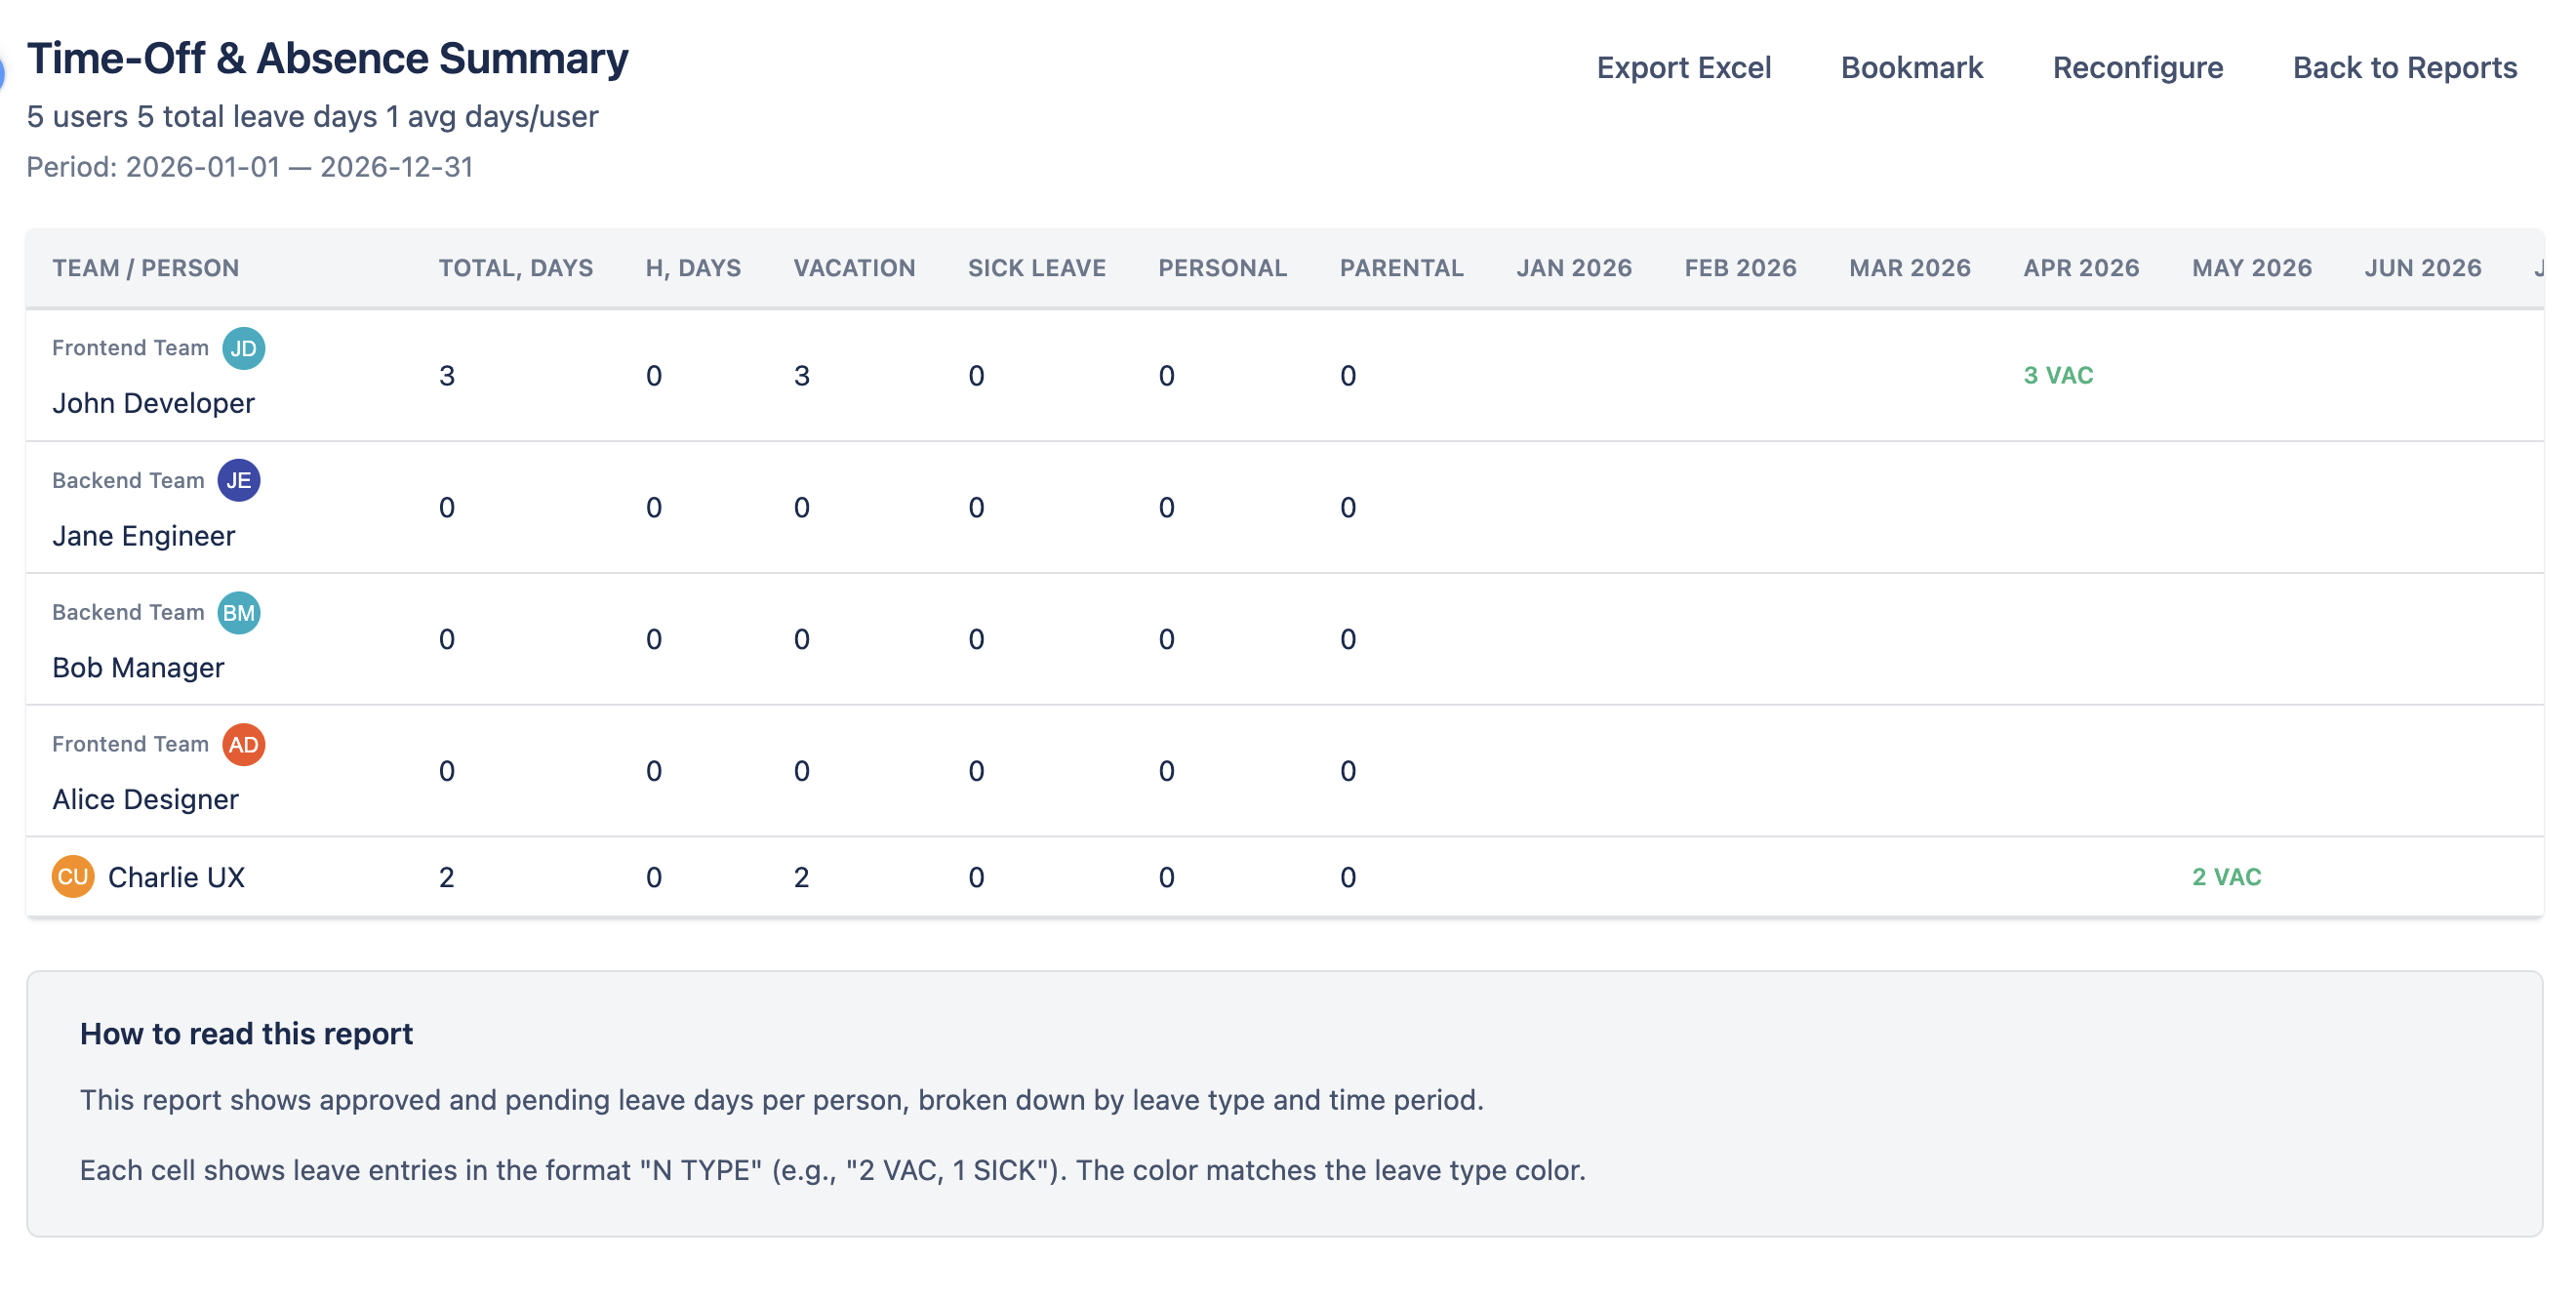
Answers: who is away, and when? Shows approved leave days per person, split by leave type and period, plus public holidays. Group by Team adds a subtotal per team.
Work Log Audit Trail Back to top
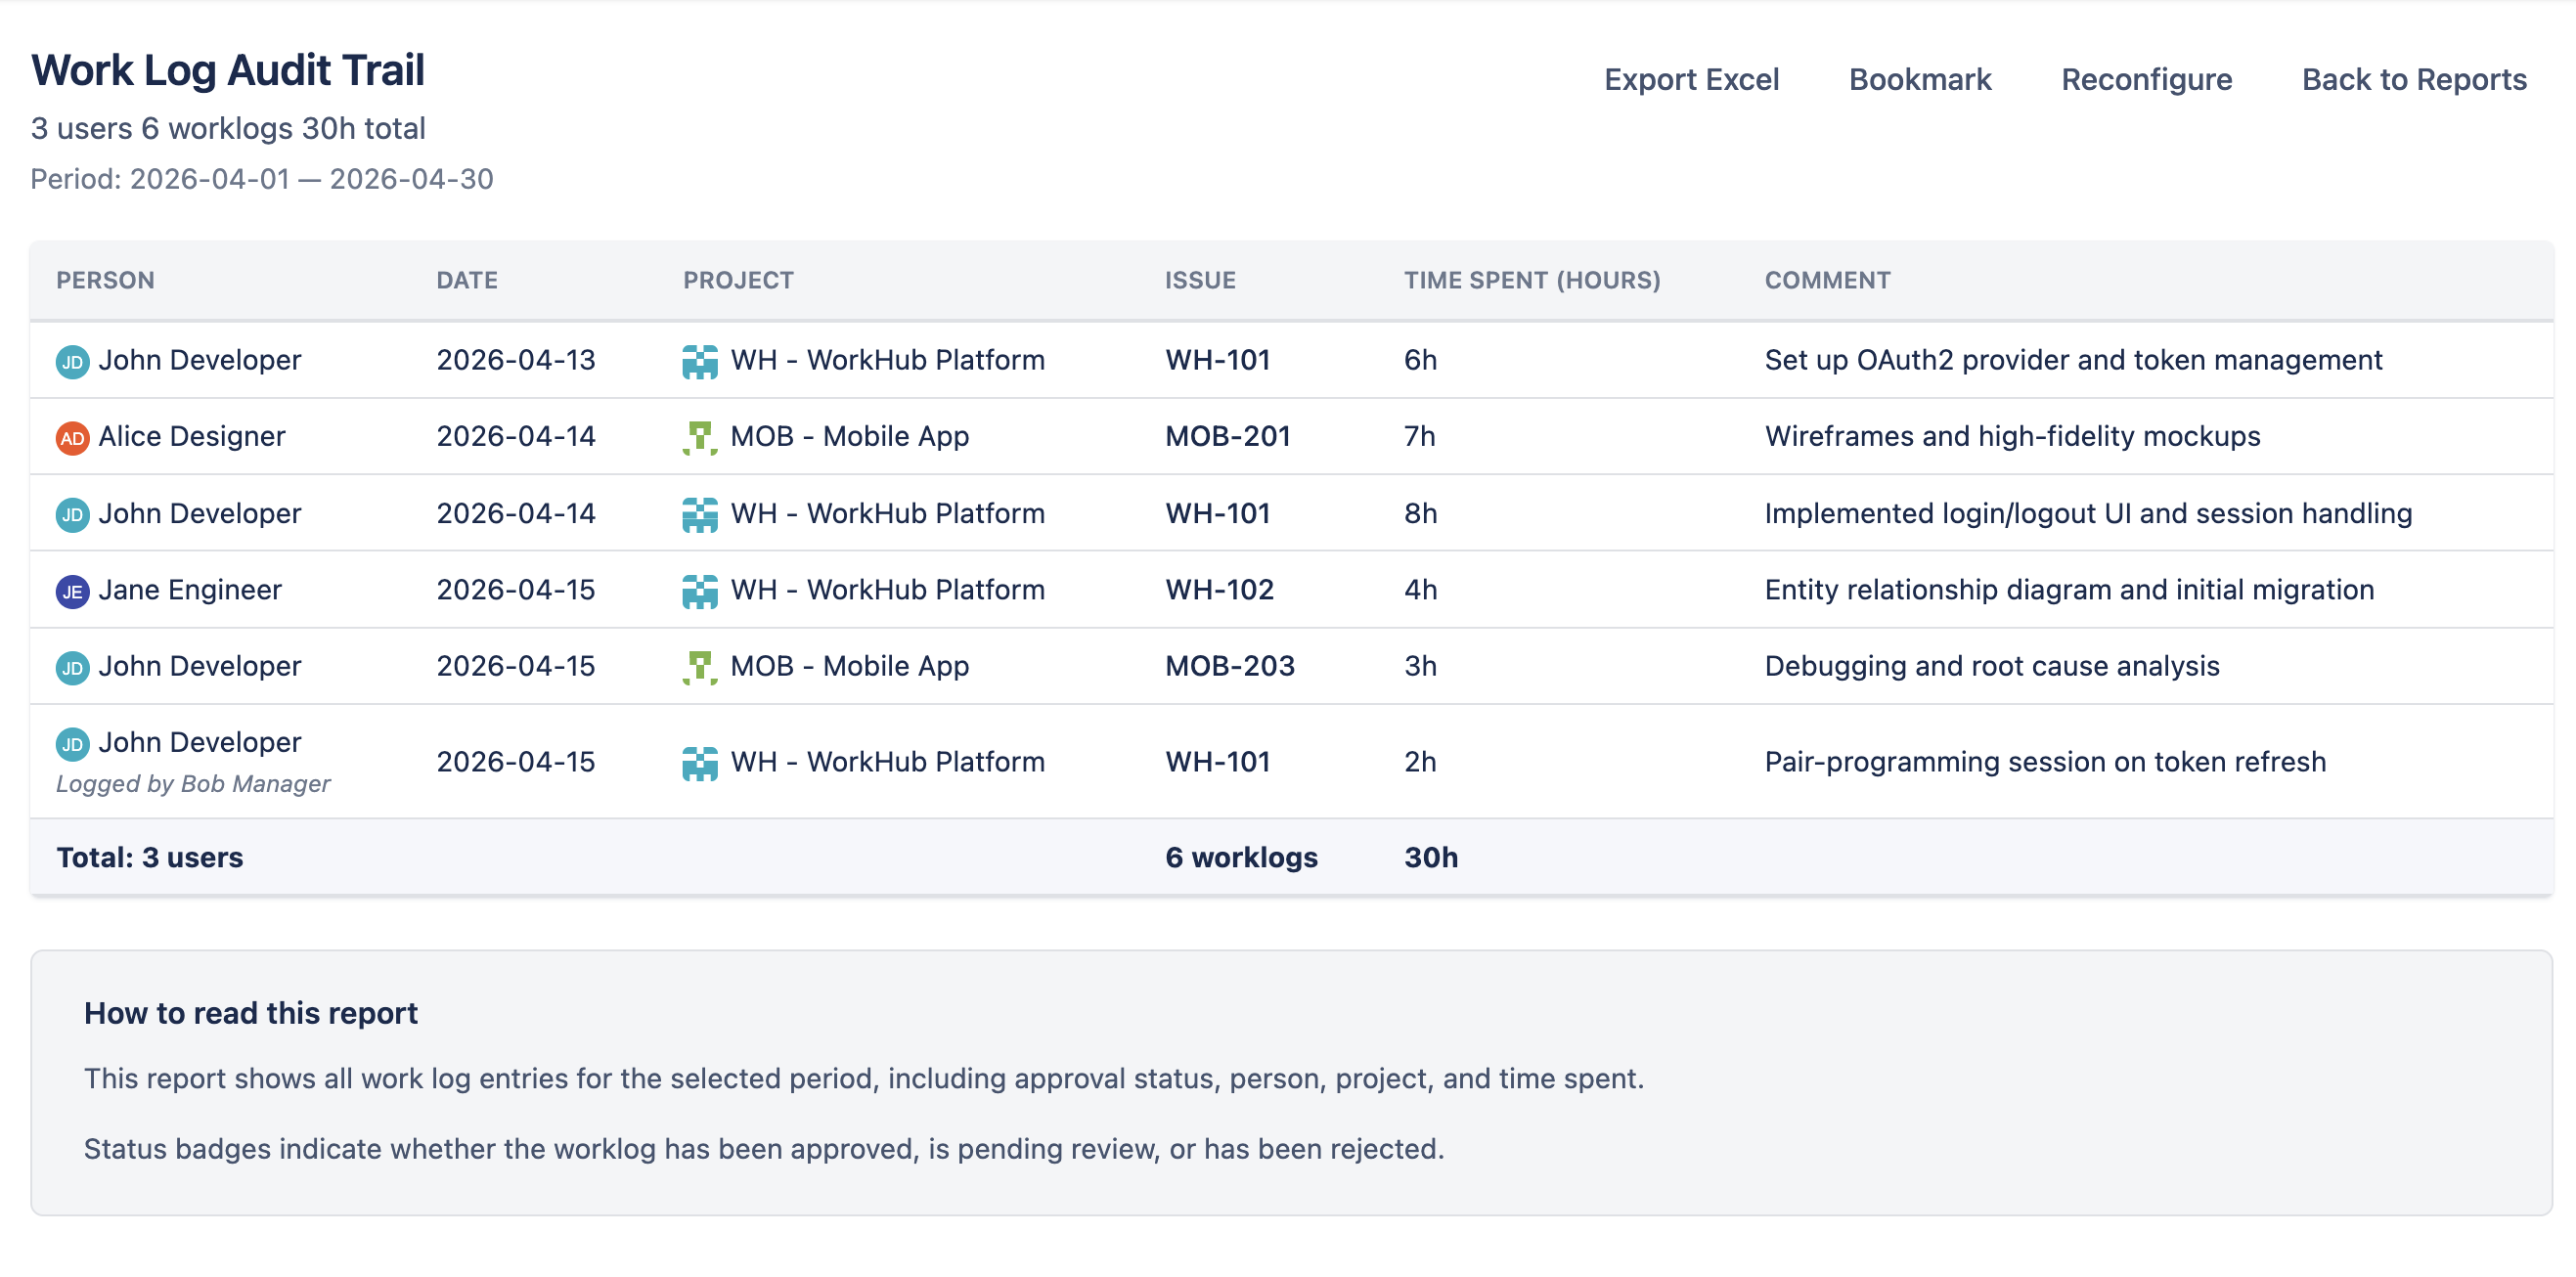
Answers: who logged what, when? Lists every work log in the period with person, date, project, issue, time spent and comment (plus Category when more than one worklog category exists) — useful for billing and timesheet reviews. With timesheet approval on, it also shows the approval Status and Approved by. Include allocations adds time logged on allocations; Group by Team adds team subtotals.
Planned vs Actual Back to top
Answers: are our original estimates holding? For each issue it compares the Original Estimate with Time Spent plus Remaining, and gives a verdict. Group by Project shows project totals; Issue lists every issue under its project.
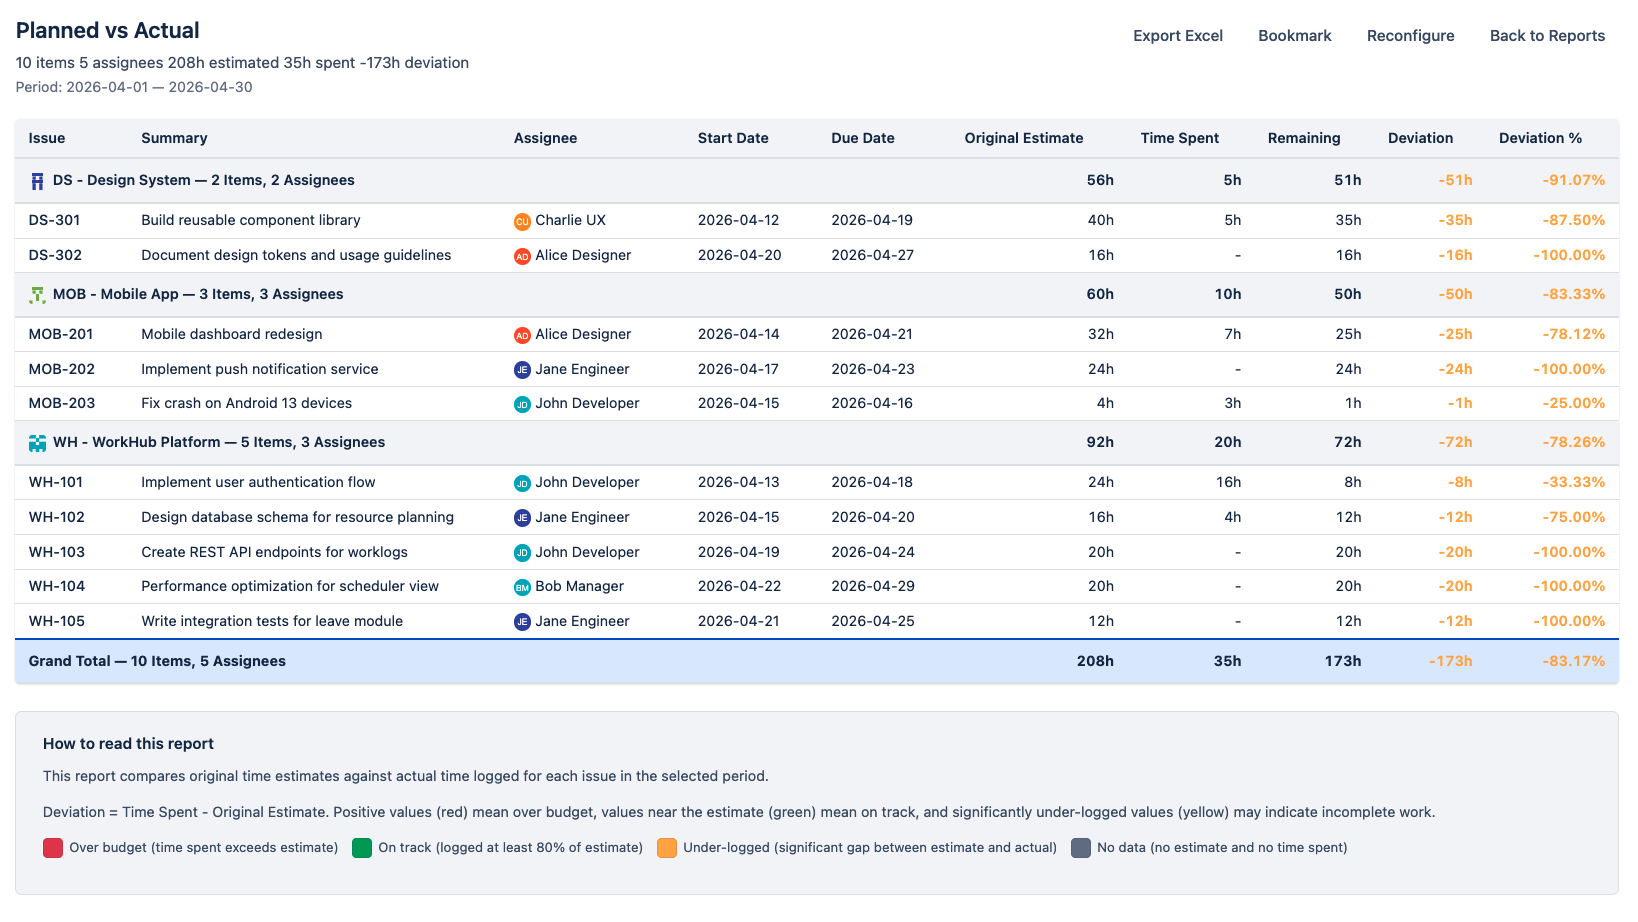
- ON TRACK — spent plus remaining still matches the original estimate.
- UNDERESTIMATED — more work is now needed than planned.
- OVERESTIMATED — less work was needed than planned.
Bookmarking Reports Back to top
Click Bookmark on a report, give it a name and save it. It appears in Bookmarked Reports, where one click re-runs it. Periods such as Current Month move with the calendar; use Custom Range to keep fixed dates. After changing an open bookmark, choose Update or Save as New.
Exporting to Excel Back to top
Click Export Excel on any report to download an .xlsx file with the same rows, groups, totals and colors you see on screen.
Need Help?
If you have questions or need assistance, our support team is here to help.
Contact Support