Overview Back to top
Workload indicators add a small colored bar under each person for every day on the Scheduler. Each bar compares the work scheduled for that day with the hours the person is available, after holidays and approved leave are taken off.

Each person's row also shows a total for the period on screen. In the Year - Monthly view, there is one bar per month instead of one per day.
Turning Workload On Back to top
Use the workload On / Off switch in the Scheduler toolbar to show or hide the indicators. The dropdown next to it opens Choose Workload Mode, where you pick what the bars show (see View modes) and whether numbers appear in hours (h) or as a percentage (%).

What the Colors Mean Back to top
The percentage is scheduled hours divided by available hours for that day.
| Color | Meaning |
|---|---|
| Light blue | Under 50% — plenty of free time |
| Yellow-green | 50–79% — partly loaded, room for more |
| Green | 80–100% — well loaded, the healthy target |
| Orange | 101–120% — slightly overbooked |
| Red | Over 120% — overbooked, needs action |
| Blue | On approved leave |
| Deep orange | Public holiday |
| Red with ⚠ | Conflict — work is scheduled on a leave or holiday day |
| Light grey | No work scheduled (non-working days have no bar) |
Workload Basis: Live or Planned Back to top
An admin chooses the Workload basis for the whole site in Settings → General. It drives the Scheduler and the forecast reports.
- Live workload (default) — shows the work still left on each issue (Jira's remaining estimate), from today onward. It shrinks as people log time. Best if your team logs work in Jira.
- Planned workload — spreads each issue's estimate over all of its dates, past days included. Best if your team rarely logs work or estimates in story points. The admin also picks the Estimate source: Original estimate (default) or Remaining estimate.
By default, issues that are already done still count if they have hours left. An admin can switch Resolved issues to Exclude resolved issues to leave them out.
View Modes Back to top
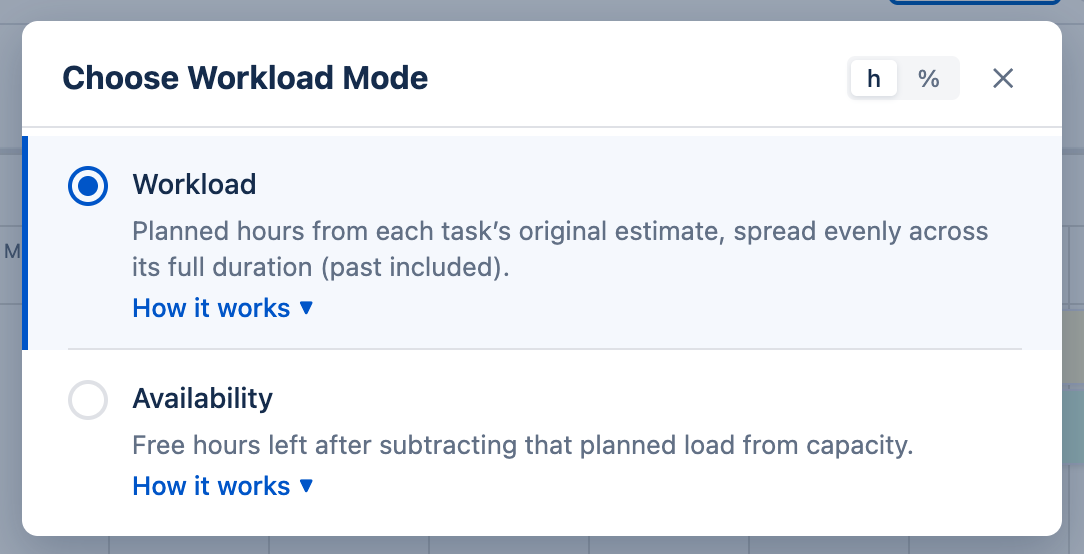
In Choose Workload Mode, each person picks how their own Scheduler shows workload. This changes only your view; reports always follow the site's Workload basis.
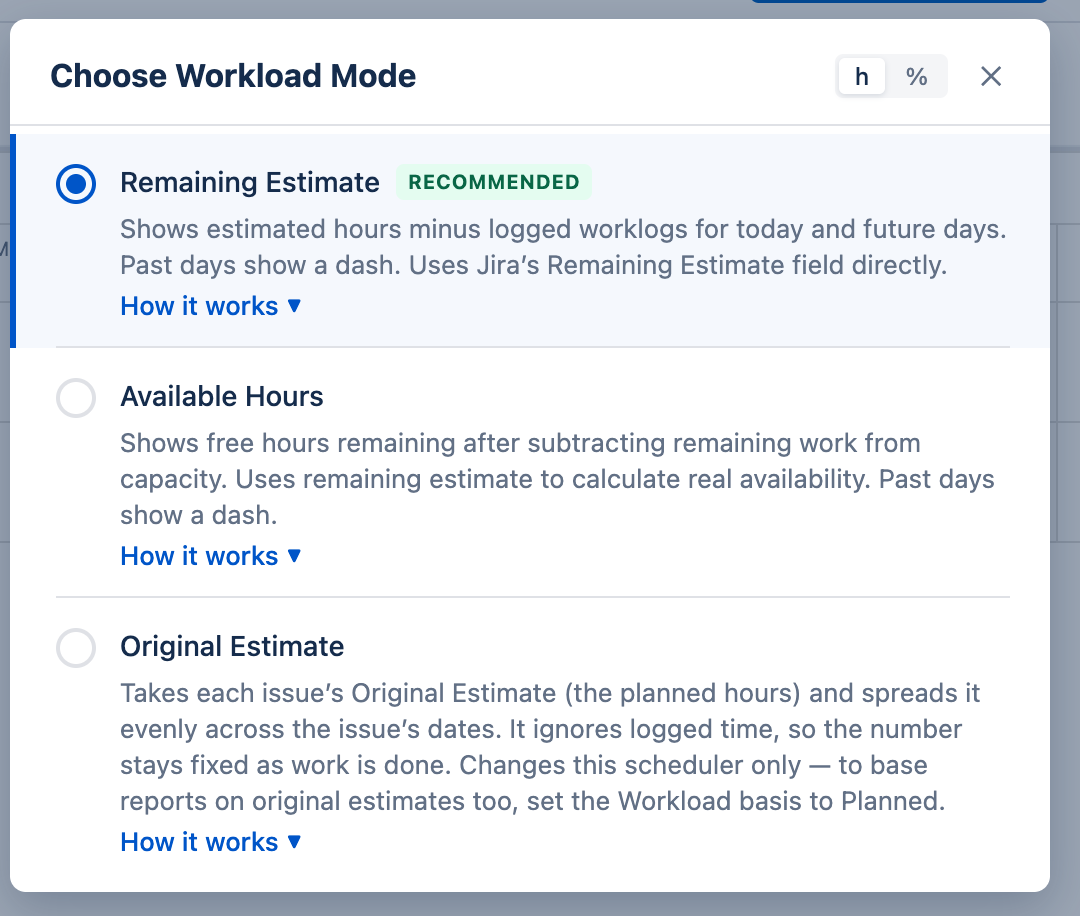
| Basis | Modes you can pick |
|---|---|
| Live | Remaining Estimate (work left, from today), Availability (free hours left), or Original Estimate (the planned hours spread over the issue's dates). |
| Planned | Workload (planned hours) or Availability (free hours left). |
How Workload Is Calculated Back to top
An issue's hours are spread evenly over the working days between its start and end dates. For example, 16 hours over 2 days shows as 8 hours a day. Allocations add their hours per day. Issues with no estimate add nothing.
Available hours come from the person's capacity scheme, minus holidays and approved leave. With 8 available hours, 6 scheduled hours is 75% (yellow-green), and 10 hours is 125% (red).

Planning with Story Points Back to top
If your team estimates in story points, an admin can turn them into hours in Settings → General → Story Point Conversion (for example, 1 story point = 5 hours). Projects can use their own rate in Per Project Configuration. Story points never go down as work is logged, so use them with the Planned workload basis.
Split Issues Back to top
For a split issue, each person's workload counts only their own part.
- Total hours — a budget spread over the part's working days (10h over 5 days = 2h a day). Time logged through WorkHub reduces what is left.
- Hours per day — the same hours on every working day of the part, such as a daily support shift. It keeps counting even after the issue is done.
Day Details Back to top
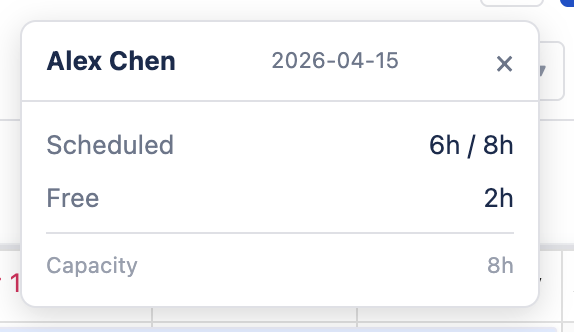
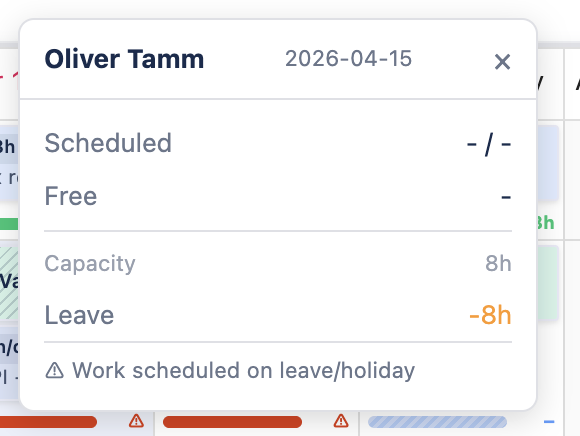
Click any workload bar to see that day's Scheduled, Free and Capacity hours. On a leave or holiday day it also shows the hours taken off, and a Work scheduled on leave/holiday warning if something is planned that day. Click a person's period total to see the same breakdown for the whole period.
Tips Back to top
- To fix a red day, drag an issue to another day, or drag it to another person's row to reassign it.
- Use Availability mode to see exactly how many free hours each person has.
- Keep estimates up to date in Jira — the bars are only as accurate as the estimates behind them.
- For longer periods, use the Resource Utilization Forecast report.
Need Help?
If you have questions or need assistance, our support team is here to help.
Contact Support