Timesheets show the hours people logged, grouped the way you need, and compare them with capacity or plans. Pick a view from the left sidebar. Submitting and approving timesheets is covered in Timesheets Approval.
Toolbar & Filters Back to top
All views share the same toolbar:

- Period — a week, month, quarter, year, or Custom Range.... Arrows step one period; Today jumps back to now.
- Day / Week / Month — how much time each column covers.
- Team / Users or Jira filter — choose whose hours to show, or only work on issues from a saved Jira filter.
- Filter — narrow by project, worklog type (issue or allocation), and category.
- Bookmarks — save the current view and filters to reopen later. Bookmarks are personal.
- Export Excel — download what you see as a spreadsheet.
Click any cell to see the worklogs and approved leave behind it for that person and date.

Cell Colors Back to top
On person rows, each cell is colored by logged hours compared with that person’s capacity. The leave and holiday colors show in Day columns only.
| Color | Meaning |
|---|---|
| Light blue | Under 50% of capacity |
| Yellow-green | 50–80% |
| Green | 80–100% (on track) |
| Yellow | 100–120% |
| Red | Over 120%, or work logged on a leave, holiday, or non-working day |
| Blue | Approved leave, nothing logged |
| Orange | Public holiday, nothing logged |
User & Project Timesheets Back to top
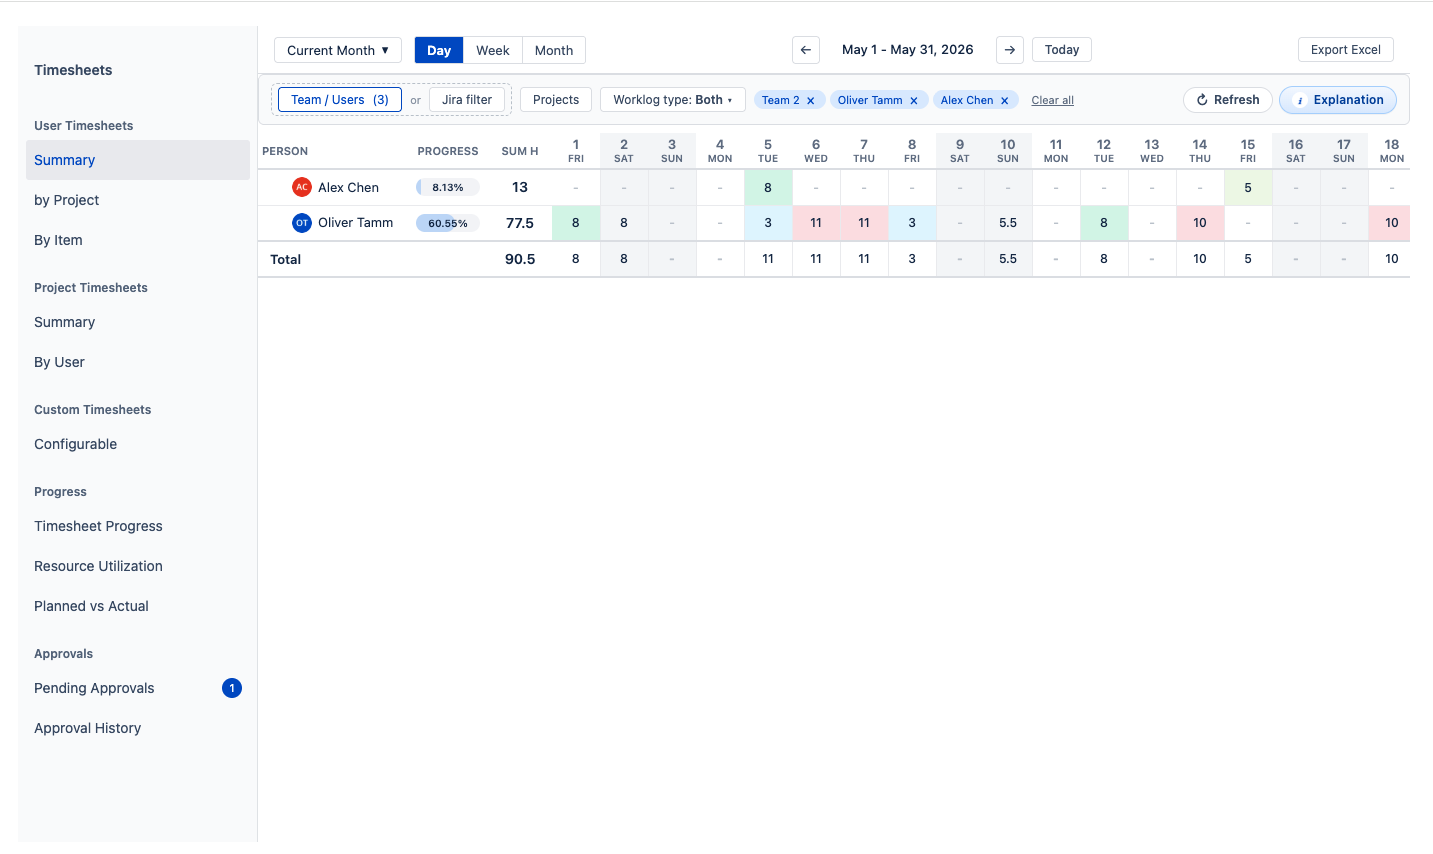
User Timesheets show hours per person: Summary (one row each), By Project, By Issue, or By Epic. Work outside any epic is listed under Without Epic.
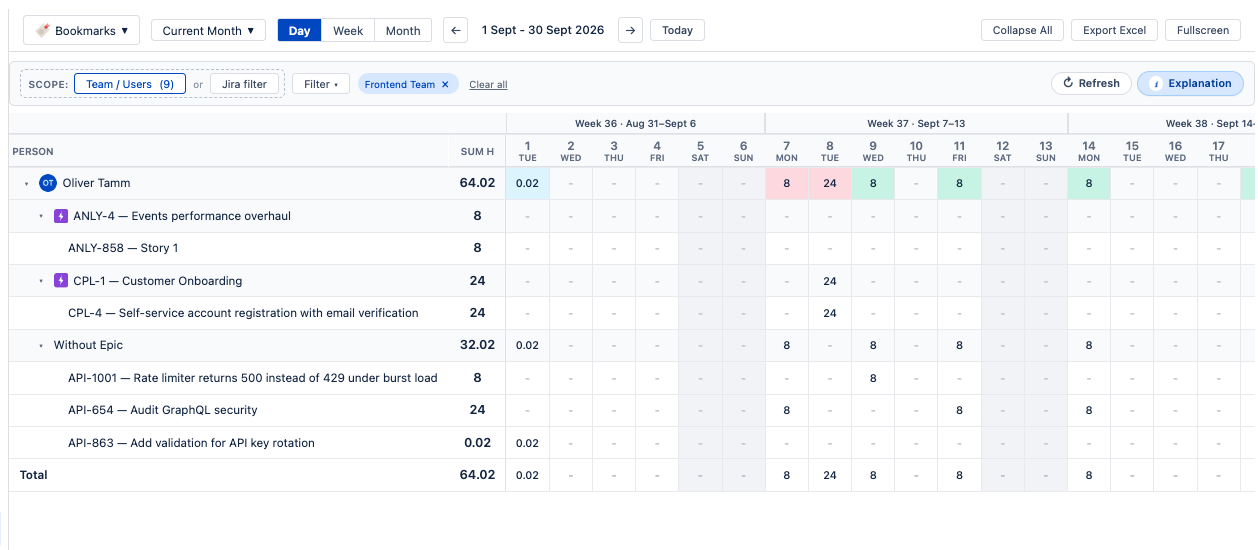
Project Timesheets show the same hours per Jira project: Summary or By User. Use Expand All and Collapse All to open or close grouped rows.
Epic Timesheets Back to top
Epic Timesheets add up the hours logged on each epic and everything under it, so you can see what a body of work has cost. Choose Summary, By User, or By Issue. These views show logged hours only.
Detailed Timesheet Back to top
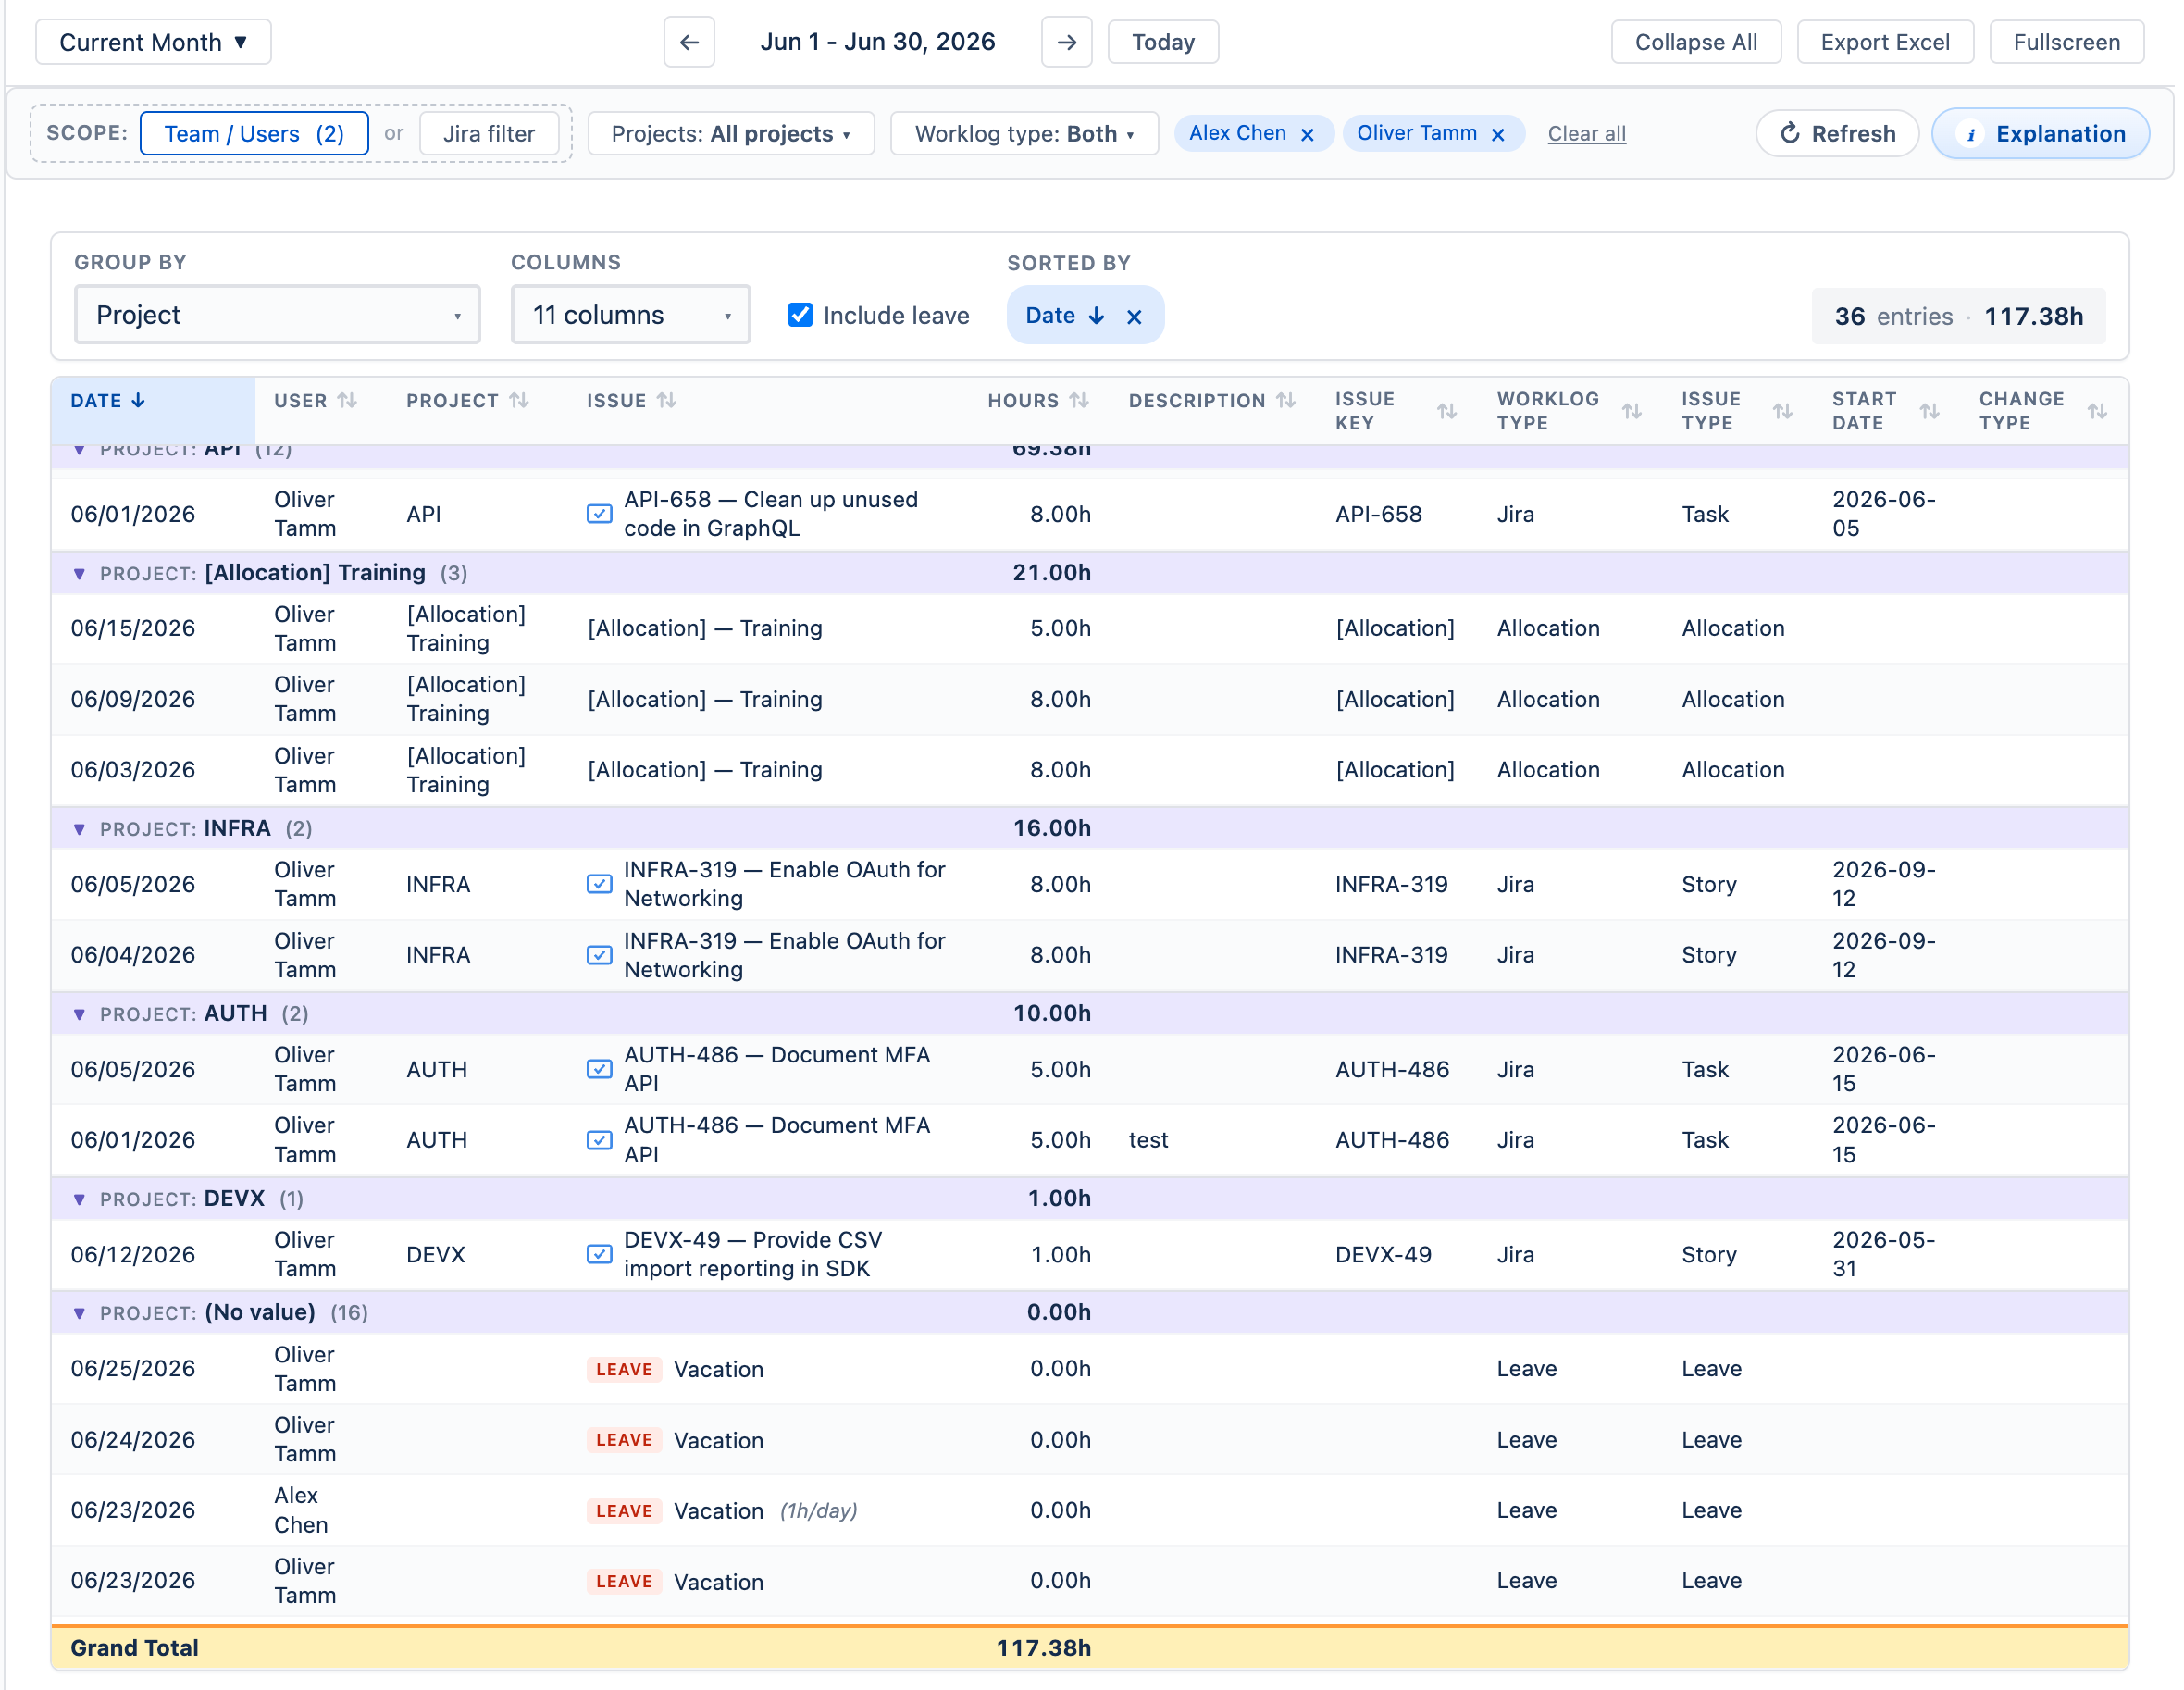
Detailed (under User Timesheets) lists every worklog as its own row — handy for audits and exports. Choose a Group by field, pick Columns, tick Include leave to add approved leave, and sort by clicking a column header. A Grand Total sums the view.
Progress Reports Back to top
The Progress section has three reports, colored like the cells above:
- Timesheet Progress — required hours vs logged. Are people filling in their timesheets?
- Resource Utilization — required hours vs planned work (original estimates plus allocations). Is anyone overbooked?
- Planned vs Actual — planned vs logged. Did the estimates hold up?
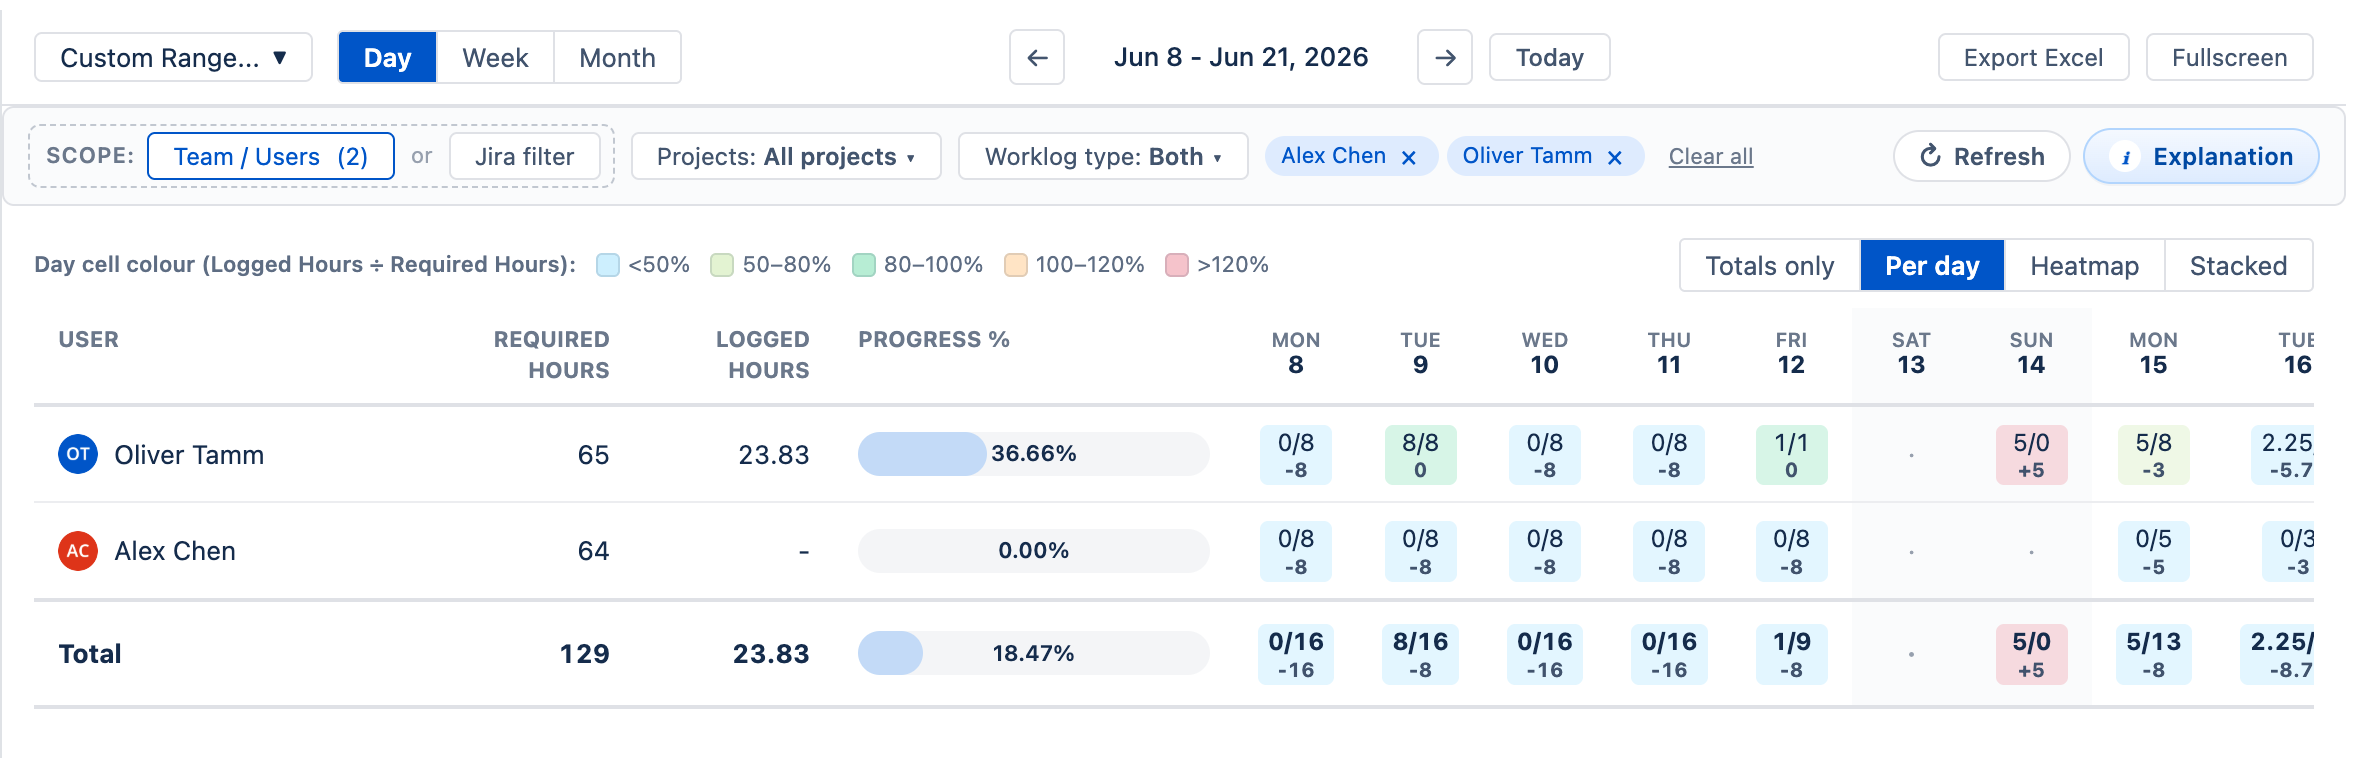
Switch how each day is shown with Totals only, Per day, Heatmap, or Stacked. Hover over a day for the full numbers.

Custom Timesheets Back to top
Custom grouping lets you build your own breakdown with up to five levels of Jira fields — for example Worklog Author → Project → Epic. Items without a value are grouped under “(No value)”.

Who sees whose timesheets Back to top
You see your own hours. Team managers, approvers, and viewers see the people assigned to them, and admins see everyone. Sharing a team with someone does not let you see their worklogs. Details: Permissions.
Need Help?
If you have questions about timesheets or need help with your setup, our support team is here to help.
Contact Support